FIGURE 4.

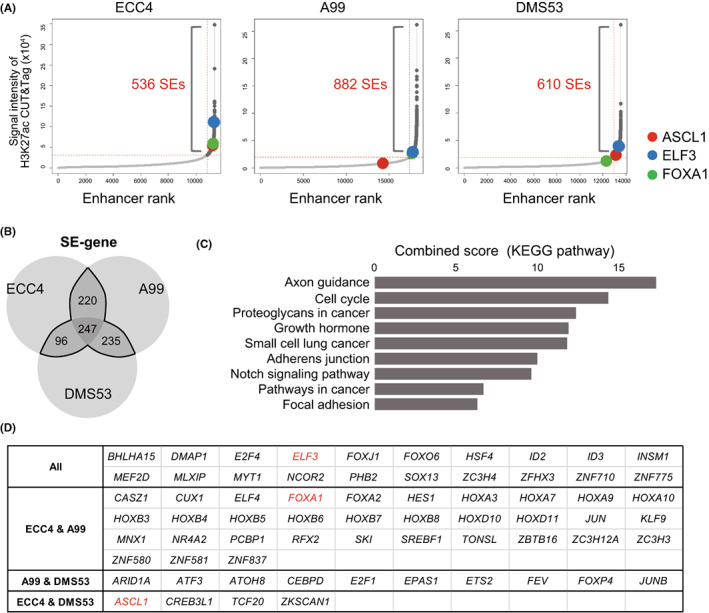
Super‐enhancers in ECC4, A99, and DMS53. A, Enhancer distributions in ECC4, A99, and DMS53. Enhancer regions are plotted in increasing order based on their H3K27Ac cleavage under targets and tagmentation (CUT&Tag) signals. B, Venn diagram showing overlapping super‐enhancer (SE) genes in ECC4, A99, and DMS53. C, Bar chart showing the combined score calculated by EnrichR pathway analysis (KEGG) of 798 SE genes. D, List of SE‐related transcription factors that overlapped in ECC4, A99, and DMS53
