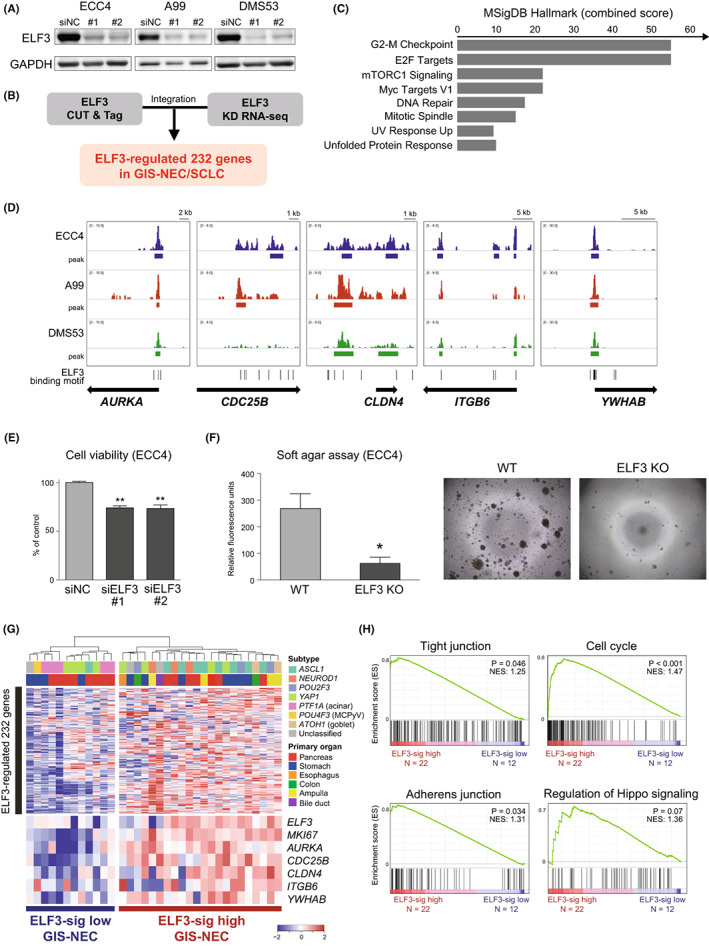
FIGURE 6.

Identification of ELF3‐regulated gene signature and clinical relevance. A, Immunoblotting for ELF3 in ECC4, A99, and DMS53 cells treated with the negative control (siNC) or siELF3. GAPDH was used as a loading control. B, Flowchart for extracting ELF3‐regulated genes by combining cleavage under targets and tagmentation (CUT&Tag) for ELF3 and ELF3 knockdown RNA‐seq. C, Bar chart showing the combined scores calculated by EnrichR pathway analysis (MSIgDB Hallmark) of 232 ELF3‐regulated genes. D, IGV visualization of ELF3 CUT&Tag signals for representative five ELF3‐regulated genes (AURKA, CDC25B, CLDN4, ITGB6, and YWAHB). E, Bar chart showing cell viability at 96 h after ELF3 knockdown by siRNA in ECC4, A99, and DMS53 cells. Data are representative of three independent experiments. **p < 0.01. F, Bar chart showing colony formation in soft agar at day 7 in the ELF3 knockout clone of ECC4 cells. Data are representative of three independent experiments. *p < 0.05. G, Heatmap showing ELF3‐regulated 232 genes in 34 neuroendocrine carcinomas of the gastrointestinal system (GIS‐NECs). Unsupervised clustering identified two clusters: ELF3‐sig–high GIS‐NEC and ELF3‐sig–low GIS‐NEC. H, Enrichment plot of GSEA with 34 GIS‐NEC gene expression data
