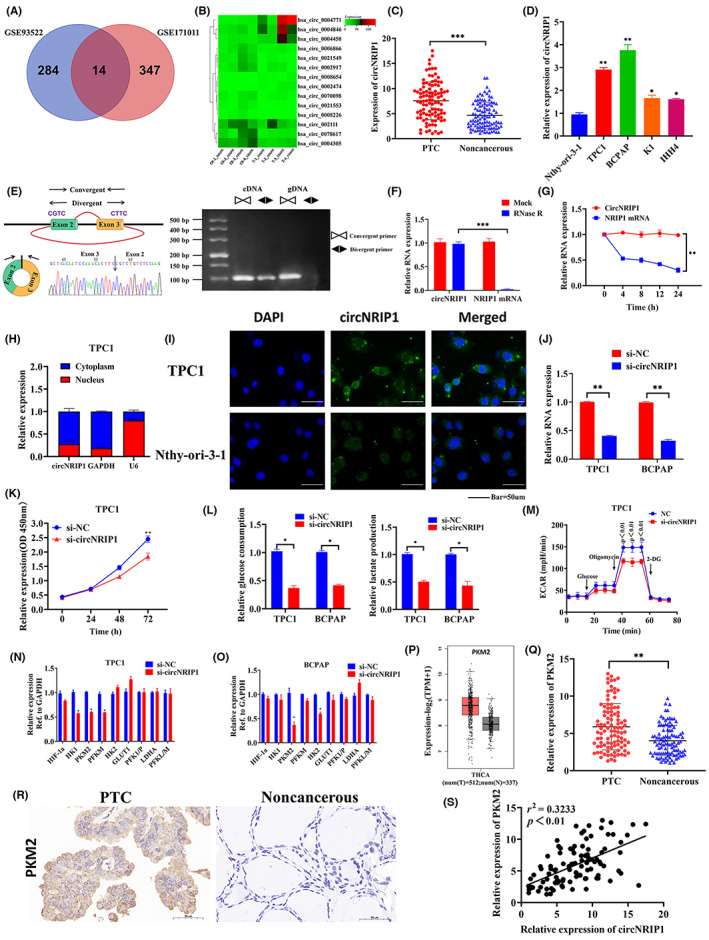
FIGURE 1.

Circular RNA nuclear receptor‐interacting protein 1 (circNRIP1) upregulation in papillary thyroid cancer (PTC): characterization of circNRIP1 in PTC; circNRIP1 promotes PKM2 expressions in PTC cells. (A,B) circNRIP1 was selected using (A) the Gene Expression Omnibus database (GSE93522 and GSE171011) and (B) the bioinformatics software. (C) Relative expression of circNRIP1 in 102 pairs of PTC tissues and adjacent noncancerous tissues. (D) Relative expression of circNRIP1 in PTC cells and normal thyroid cells determined by quantitative real‐time PCR (qRT‐PCR). (E) Genomic locus of circNRIP1. Left, expression of circNRIP1 assessed by qRT‐PCR followed by Sanger sequencing. Arrows represent divergent primers binding the genome region of circNRIP1. Right, qRT‐PCR products with divergent primers showing circNRIP1 circularization. gDNA, genomic DNA. (F) qRT‐PCR showing the expression of circNRIP1 and NRIP1 mRNA after treatment with RNase R in TPC1 cells. (G) qRT‐PCR showing the expression of circNRIP1 and NRIP1 mRNAs after treatment with actinomycin D at indicated time points in TPC1 cells. (H) Nuclear and cytoplasmic RNA fractions isolated from TPC1 cells. CircNRIP1 was mainly located in the cytoplasm; GAPDH and U6 were used as controls. (I) FISH verification showing that circNRIP1 is mainly localized in the cytoplasm. Scale bar, 50 μm. (J) Quantitative PCR showing that si‐circNRIP1 can significantly inhibit circNRIP1 expression in TPC1 and BCPAP cells. (K) CCK‐8 assay showing the proliferative abilities of TPC1 cells after circNRIP1 knockdown. (L) Glucose uptake and lactate production determined after transfection with si‐NC (non‐silencing contron) and si‐circNRIP1 in TPC1 and BCPAP cells. (M) Extra cellular acidification rate (ECAR) determined by Seahorse metabolic analysis after transfection with si‐NC and si‐circNRIP1 in TPC1 cells. (N,O) Relative expression of glycolysis‐related genes after circNRIP1 downregulation detected by qRT‐PCR in (N) TPC1 and (O) BCPAP cells. (P) pyruvate kinase M2 (PKM2) expression in PTC and normal tissues from The Cancer Genome Atlas database. (Q) Relative expression of PKM2 in 102 pairs of PTC tissues and adjacent noncancerous tissues. (R) Representative PKM2 immunohistochemical staining of PTC tissues, compared with paired normal thyroid tissues. Scale bar, 50 um. (S) Correlations between circNRIP1 and PKM2 levels in PTC tissues analyzed by Pearson's correlation analysis. *p < 0.05, **p < 0.01, ***p < 0.001
