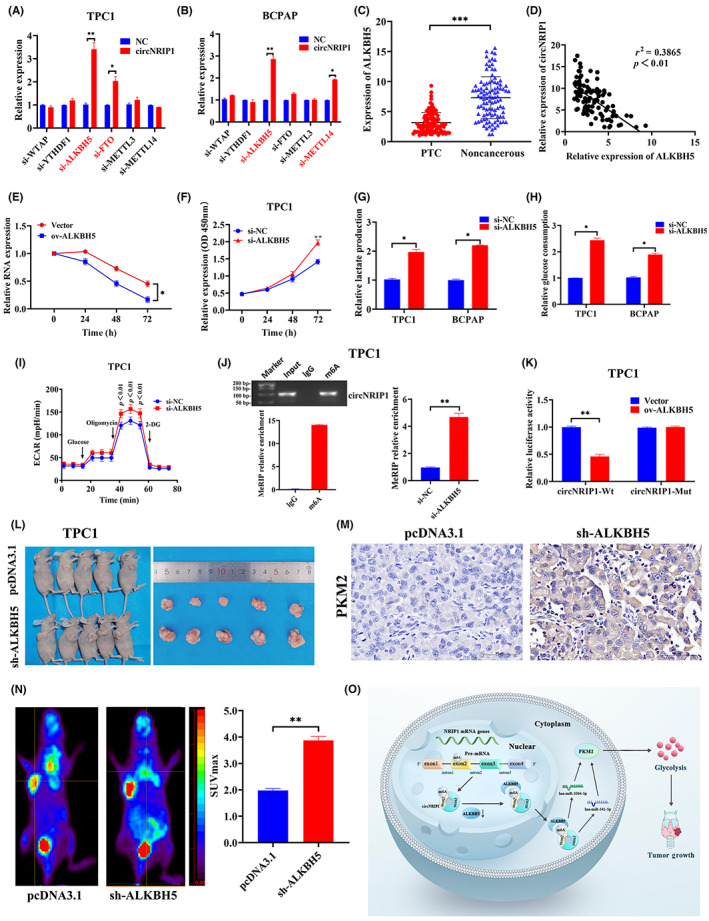
FIGURE 6.

α‐Ketoglutarate‐dependent dioxygenase alkB homolog 5 (ALKBH5) inhibits circular RNA nuclear receptor‐interacting protein 1 (circNRIP1) expression in papillary thyroid cancer (PTC) cells. ALKBH5 is negatively correlated with circNRIP1 and regulates PTC proliferation by modulating glycolysis. (A,B) Quantitative real‐time PCR (qRT‐PCR) showing relative expressions of predicted circNRIP1 after downregulation of m6A‐related genes in (A) TPC1 and (B) BCPAP cells. (C) qRT‐PCR showing relative expression of ALKBH5 in 102 pairs of PTC tissues and adjacent noncancerous tissues. (D) Correlations between ALKBH5 and circNRIP1 in PTC tissues analyzed by Pearson's correlation analyses. (E) Actinomycin D assays showing the expression and stability of circNRIP1 after ALKBH5 overexpression. (F) TPC1 cell proliferation evaluated using CCK‐8 assay. (G) Lactate production and (H) glucose uptake by TPC1 and BCPAP cells after transfections with non‐silencing control (si‐NC) and si‐ALKBH5. (I) Extra cellular acidification rate (ECAR) in TPC1 cells determined by Seahorse metabolic analysis after transfections with si‐NC and si‐ALKBH5. (J) Left, direct binding between m6A Ab and circNRIP1 validated by agarose electrophoresis and methylated RNA immunoprecipitation (MeRIP) assays in TPC1 cells. Right, relative enrichment of the m6A Ab and circNRIP1 determined by MeRIP‐qPCR after ALKBH5 knockdown in TPC1 cells. (K) Relative luciferase activities of circNRIP1‐WT and circNRIP1‐Mut after ALKBH5 overexpression in PTC cells. (L) Subcutaneous implant mouse model established after inoculation with TPC1 cells transfected with pcDNA3.1 or sh‐ALKBH5 vectors (n = 5). (M) Tumor sections stained with H&E. Pyruvate kinase M2 (PKM2) was assessed by immunohistochemistry. (N) Representative images of 18F‐fluoro‐2‐deoxyglucose (18F‐FDG) uptake by micro‐PET imaging in pcDNA3.1 and sh‐ALKBH5 xenograft mouse models. Red circles indicate tumor glucose uptake. Maximum uptake values (SUVmax) for xenografts were determined by 18F‐FDG PET. (O) Mechanistic diagram showing the relationships among circNRIP1, m6A modification, PTC tumor growth, and glycolysis metabolism. *p < 0.05, **p < 0.01, ***p < 0.001
