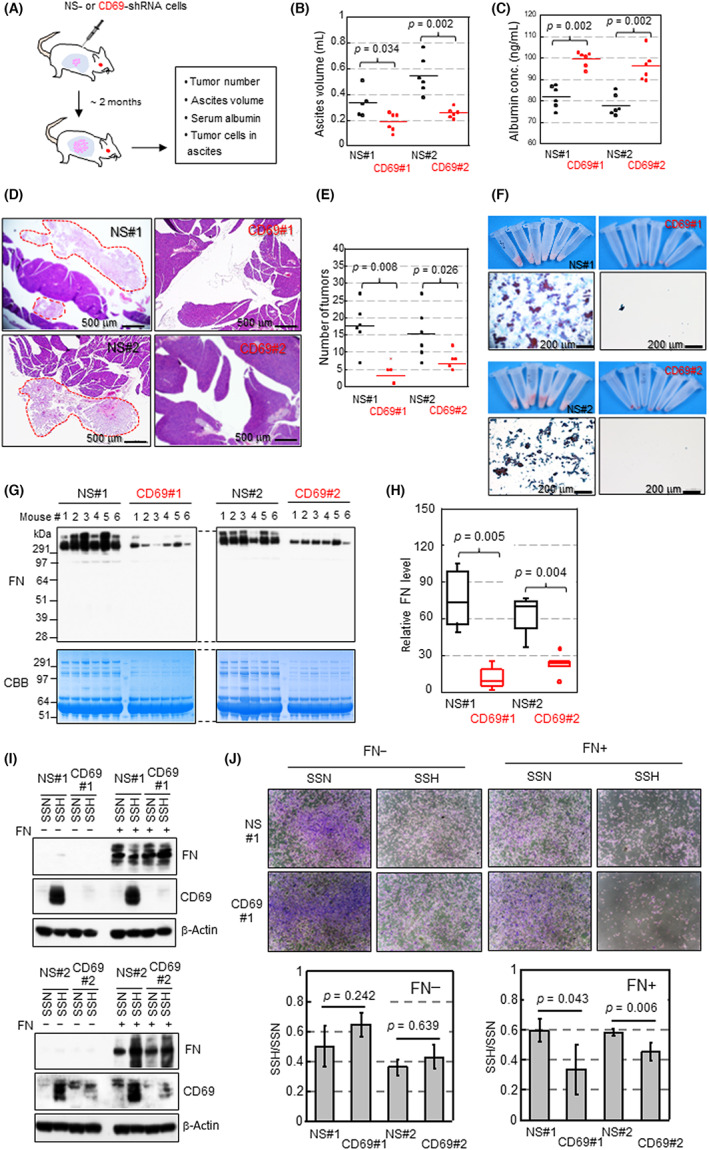
FIGURE 4.

CD69 facilitates xenograft OVISE tumor progression. (A) Schematic representation of animal experiments using six mice per group. Pink, cancer cells; light blue, peritoneal cavity. (B) Comparison of ascites. (C) Serum albumin levels (1:250,000 dilution) assessed by ELISA. (D) H&E staining of pancreas in mice. Cancer cells are surrounded with red dotted red lines. (E) Number of tumors associated with pancreas and spleen counted by microscopic examination of H&E‐stained tissues. (F) Appearance of cell pellets and cytopathological analysis of ascites samples. (G) Western blot analysis of fibronectin (FN) in ascites supernatants. Samples (20 μg protein) were loaded per lane. (H) Densitometrical quantitation of protein levels in (G). Statistical values in B, C, E, and H were calculated by the Mann–Whitney U‐test. (I) Western blot analysis of cells cultured for 48 h. (J) Cell viability assay. Cells were stained with crystal violet and quantified by ImageJ software. Data are the mean (n = 4) ± SD. Statistical values were calculated by t‐test. CBB, Coomassie brilliant blue; NS, nonspecific; SSH, serum starvation and hypoxia; SSN, serum starvation and normoxia
