
FIGURE 5.
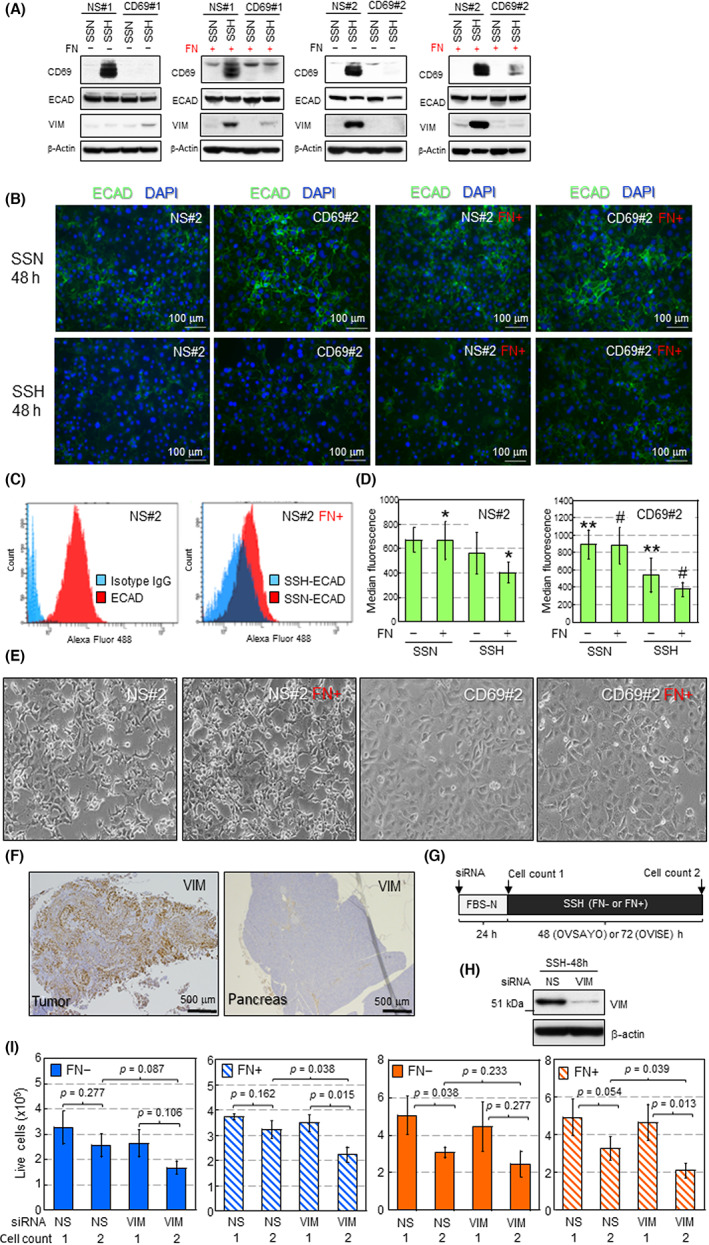
CD69–fibronectin (FN) interaction causes epithelial–mesenchymal transition (EMT). (A) Western blot analysis of EMT markers in the indicated cells. (B) Immunofluorescent staining of E‐cadherin (ECAD) in the indicated cells and culture conditions. (C) Flow cytometry of cell surface ECAD (csECAD) expressed in nonspecific (NS)#2 cells. (D) Comparison of csECAD levels in the indicated cells. Data are the mean (n = 5) ± SD. *p = 0.024, **p = 0.026, # p = 0.006. Statistical values for two datasets labeled with same symbols were calculated by t‐test. (E) Morphology of the indicated cells cultured under serum starvation and hypoxia (SSH) for 72 h. (F) Immunohistochemistry of vimentin (VIM) expression in xenograft tumor and normal pancreatic tissues shown in Figure 4D. (G) Scheme of cell viability assay. (H) Western blotting of VIM in OVISE cells. (I) Cell viability assay. Blue, OVISE; orange, OVSAYO. Data are the mean ± SD (n = 3 [OVISE], n = 4 [OVSAYO]). Statistical values were calculated by t‐test. SSN, serum starvation and normoxia