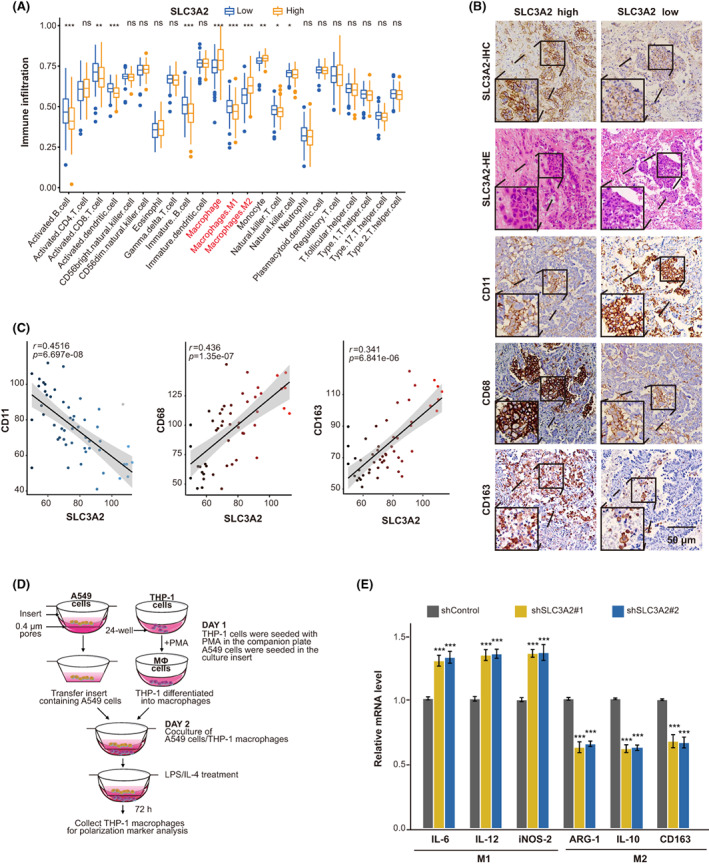
FIGURE 3.

Tumor SLC3A2 expression is positively correlated with M2 macrophage infiltration. (A) Correlation between immune cell infiltration and SLC3A2 in The Cancer Genome Atlas. Patients were divided into high and low expression groups, and the proportion of immune cells in the microenvironment is analyzed. (B) Immunohistochemical (IHC) and H&E staining of SLC3A2, IHC staining of CD163 (M2 marker), CD68 (macrophage marker), and CD11c (M1 marker) was carried out on lung adenocarcinoma samples. Scale bar, 50 μm; n = 51. (C) The H‐score of each marker was calculated, and the linear correlation scatter plots of SLC3A2 and three macrophage markers are plotted respectively. (D) Schematic diagram of coculture of macrophages and A549 cells. (E) Quantitative RT‐PCR is used to detect polarization‐related markers in cells cocultured cells. Interleukin (IL)‐6, IL‐12, and inducible nitric oxide synthase (iNOS)‐2 are used as M1 type macrophage markers, while Arginase‐1 (ARG‐1), IL‐10, and CD163 are M2 type macrophage markers. Graphs show the mean ± SEM of at least three independent experiments. *p < 0.05, **p < 0.01, ***p < 0.001, one‐way ANOVA. LPS, lipopolysaccharide; ns, no significance
