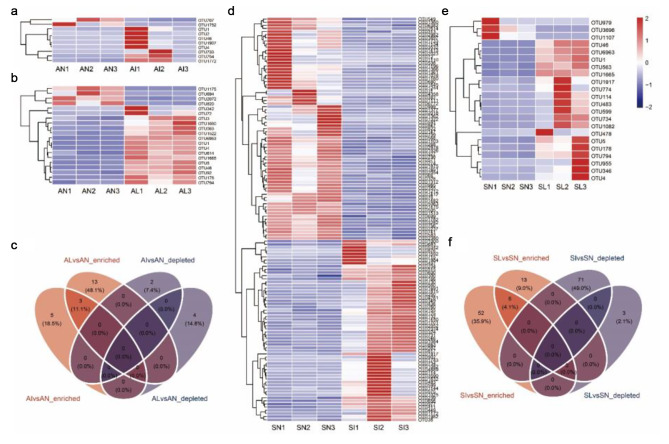
Fig. 4.
Differential OTU analysis. AN, AI, and AL represent A. tricolor rhizobacteria in noninvasive area, invasive area, and leaf extract treated area, respectively. SN, SI, and SL represent S. viridis rhizobacteria in noninvasive area, invasive area, and leaf extract treated area, respectively. Compared with the noninvasive area, the difference OTUs of the A. tricolor rhizosphere in the invasive area (a) and the leaf extract treatment area (b) were analyzed. Compared with the noninvasive area, the difference OTUs of S. viridis rhizosphere in the invasive area (d) and the leaf extract treatment area (e) were analyzed. Red represents a significant increase (Kruskall Wallis test, logFC > 1 & P < 0.05) and blue represents a significant decrease (Kruskall Wallis test, logFC < 0.5 & P < 0.05). Significantly enriched and reduced OTUs were counted (c, f)

