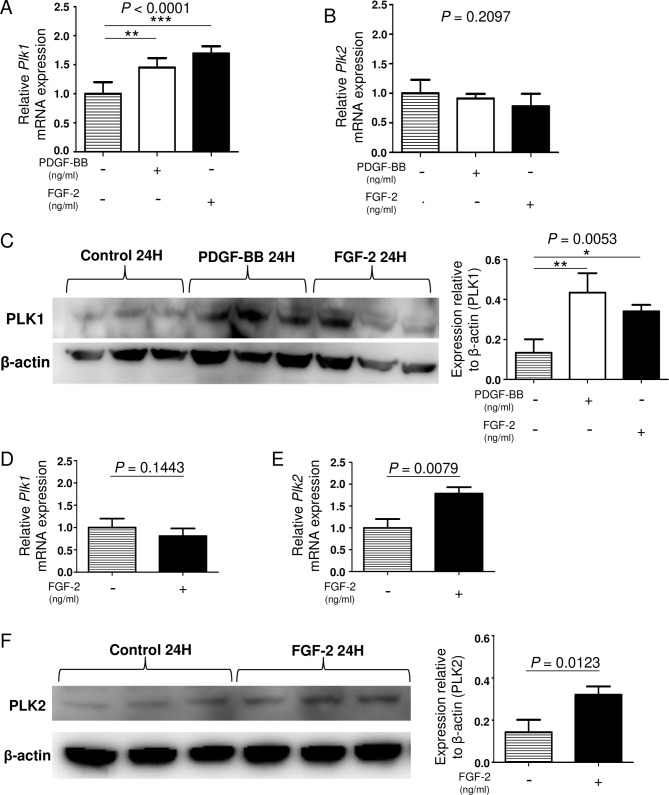
Fig. 6.
The expression of PLKs in response to growth factors differs among cell types. (A-B) The mRNA expression of Plk1 or Plk2 in cultured murine primary lung fibroblasts stimulated with PDGF-BB 100 ng/ml or FGF-2 30 ng/ml for 24 h was analyzed by quantitative PCR (n = 5 in control group; n = 5 in PDGF-BB group; n = 5 in FGF-2 group). (C) The protein expression of PLK1 in cultured primary lung fibroblasts stimulated with PDGF-BB 100 ng/ml or FGF-2 30 ng/ml for 24 h was analyzed by Western blotting (n = 3 in control group; n = 3 in PDGF-BB group; n = 3 in FGF-2 group). Data were analyzed using a one-way analysis of variance followed by Dunnett’s multiple comparison test and displayed as the mean ± SD. For all graphs: * P = 0.01–0.05; ** P = 0.001–0.01; *** P < 0.0001. The P values of each experiment are shown above each figure. (D-E) The mRNA expression of Plk1 or Plk2 in cultured murine alveolar epithelial type 2-like (LA4) cells stimulated with FGF-2 30 ng/ml for 24 h was analyzed by quantitative PCR (n = 5 in control group; n = 5 in FGF-2 group). (F) The protein expression of PLK2 in cultured LA4 cells stimulated with FGF-2 30 ng/ml for 24 h was analyzed by Western blotting (n = 3 in control group; n = 3 in FGF-2 group). Data were analyzed using unpaired t-test and displayed as the mean ± SD. The P values of each experiment are shown above each figure

