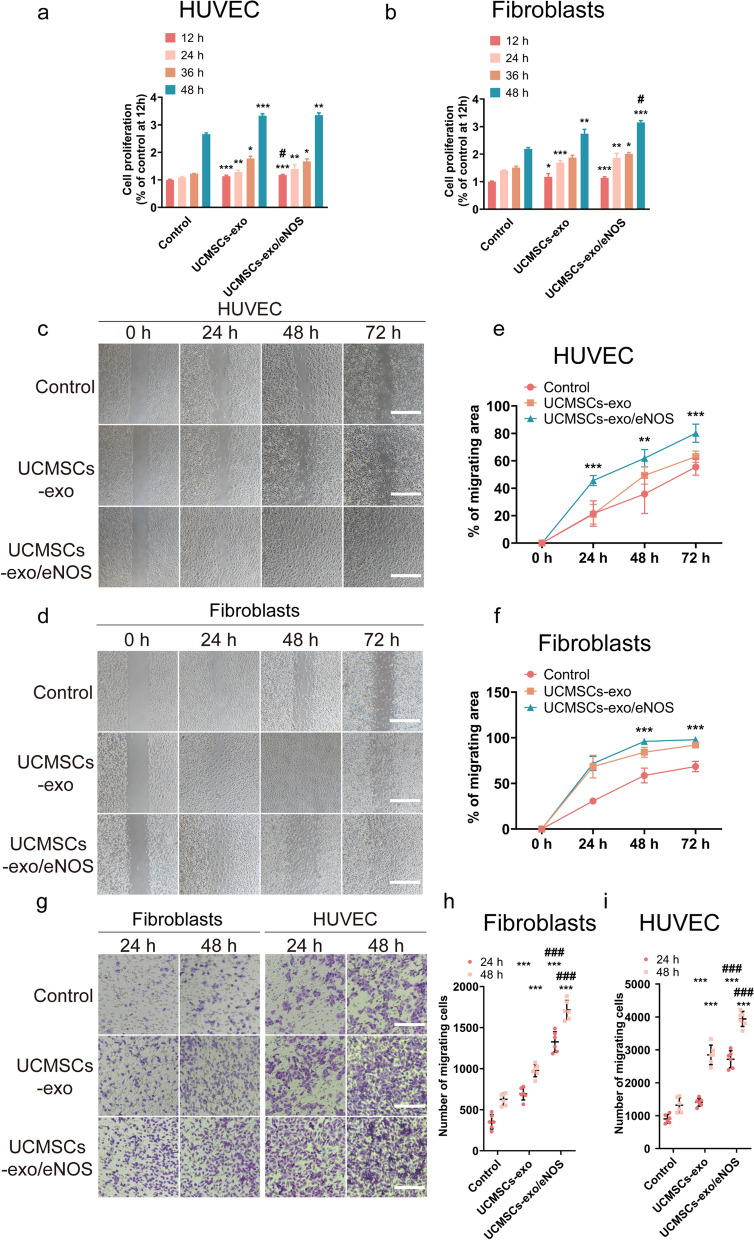
Fig. 2.
UCMSCs-exo/eNOS promote proliferation and migration of fibroblasts and vascular endothelial cells. a Proliferation of HUVECs incubated in complete medium supplemented with UCMSCs-exo and UCMSCs-exo/eNOS for 12, 24, 36, and 48 h. Each group was set up with three replicates. b Proliferation of fibroblasts incubated in complete medium supplemented with UCMSCs-exo and UCMSCs-exo/eNOS for 12, 24, 36 and 48 h. Each group was set up with three replicates. c Scratch assay to assess the migration of HUVEC treated with UCMSCs-exo and UCMSCs-exo/eNOS. Representative pictures of wound closure at 0, 24, 48, and 72 h with UCMSCs-exo vs. UCMSCs-exo/eNOS vs. Control group. Scale bar: 200 μm. d Scratch assay to assess migration of fibroblasts treated with UCMSCs-exo and UCMSCs-exo/eNOS. Representative images of wound closure at 0, 24, 48, and 72 h with UCMSCs-exo vs. UCMSCs-exo/eNOS vs. Control group. Scale bars: 200 μm. e Graph showing quantification of HUVEC wound closure. Each group was set up with six replicates. f Graph showing quantification of fibroblast wound closure. Each group was set up with 6 replicates for validation. g Representative micrographs showing the effect of UCMSCs-exo vs. UCMSCs-exo/eNOS on Transwell migration of fibroblasts and HUVECs. Scale bar: 200 μm. h Quantitative analysis of Transwell assay of fibroblasts. Each group was set up with six replicates. i Quantitative analysis of Transwell assay of HUVECs. Each group was set up with six replicates. Data represent means ± SD. *p < 0.05, **p < 0.01, ***p < 0.001 vs. Control group; #p < 0.05, ##p < 0.01, ###p < 0.001 vs. UCMSCs-exo group (two-tailed Student’s t-test)

