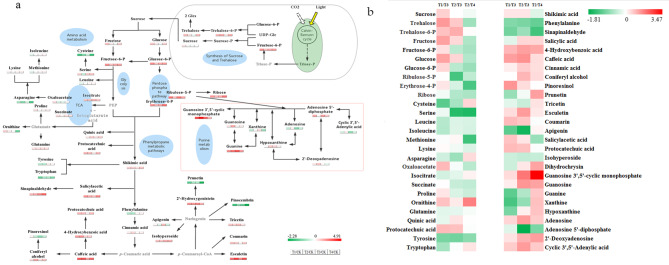
Fig. 6.
Metabolic network and metabolite analysis of Sik. leaves under low temperature stress. (a) CK vs. T1/ T2/ T3/T4 metabolic networks; (b) T1 vs. T3, T2 vs. T4, T2 vs. T3 changes in metabolites. Proposed metabolic pathways were based on the literature and web-based database of metabolic pathways. Metabolites that were not detected in this study but are important in the metabolic pathway are written in gray. The differential metabolite changes were represented by the log2 ratio. Green represents a decrease in content and red represents an increase in content

