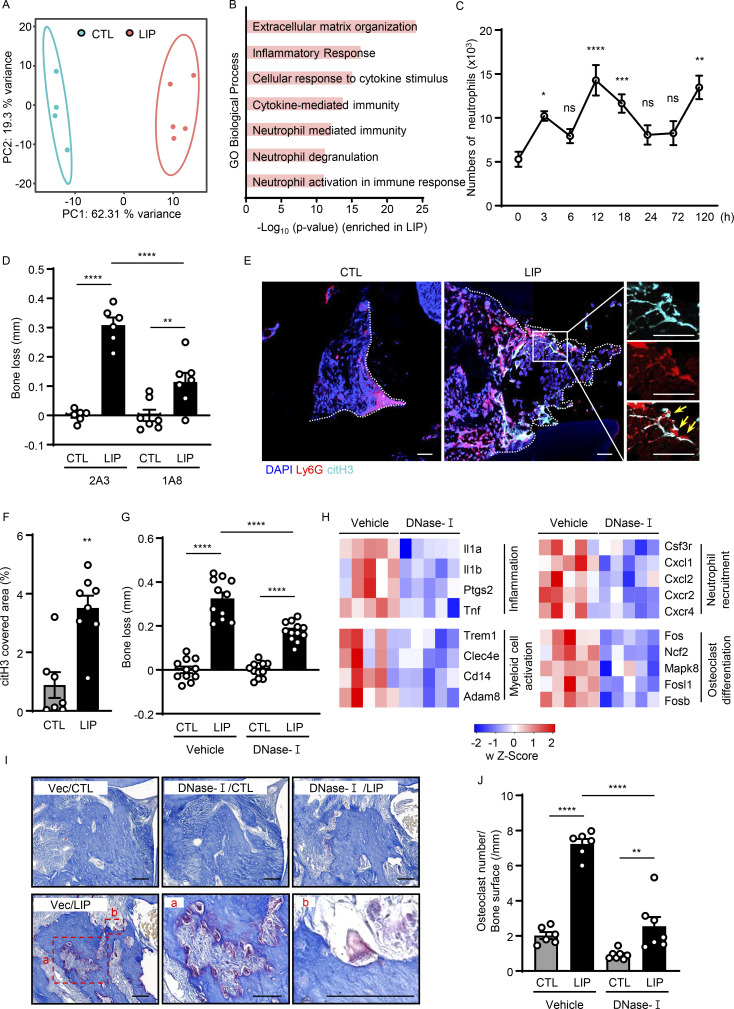
Figure 1.
Evidence of NETosis in lesions of experimental periodontitis. (A and B) Bulk RNA-seq in mouse gingival tissues from CTL (n = 4) and LIP (n = 5, 5 d). (A) Principal components analysis. (B) Gene Ontology (GO) biological processes in ascending order of P value. (C) Flow cytometry analysis of mouse gingiva CTL/LIP mice at indicated times (0–120 h). Absolute number of neutrophils (CD45+CD11b+CD11clow/medLy6G+) per standardized tissue block (n = 3–14) is shown. (D) Bone loss after LIP with isotype control (clone 2A3) or anti-Ly6G (clone 1A8) treatment. Bar graph depicts bone loss (n = 6–7, 6 d). (E and F) Immunofluorescence for citH3 and Ly6G in gingival tissue (CTL/LIP, 18 h). (E) Representative confocal images; scale bars are 50 µm. (F) Quantification, mean fluorescence intensity of citH3 staining (n = 7–8). (G and H) LIP following treatment with DNase-I or vehicle treatment. (G) Bone loss measurement (n = 11–12, 6 d). (H) RNA-seq of gingival tissues (18 h after LIP) with DNase-I (n = 5) or vehicle (n = 5). Heatmap analysis of select significantly differentially expressed genes. Each column represents a single sample. (I and J) TRAP-stained sections of gingival tissues from DNase-I or vehicle-treated mice with or without LIP (n = 6–7, 6 d). (I) TRAP-positive cells appear purplish to dark red in the sections. Scale bars are 50 µm; representative image. (J) Quantification of osteoclasts per condition, number of osteoclast/bone surface (N/mm). Data are representative of three (D, F, G, and J) or four (C) independent experiments. Graphs show the mean ± SEM. *P < 0.05, **P < 0.01, ***P < 0.001, ****P < 0.0001. One-way ANOVA with Tukey’s multiple comparison test (B–D, G, and J), unpaired t test (F).

