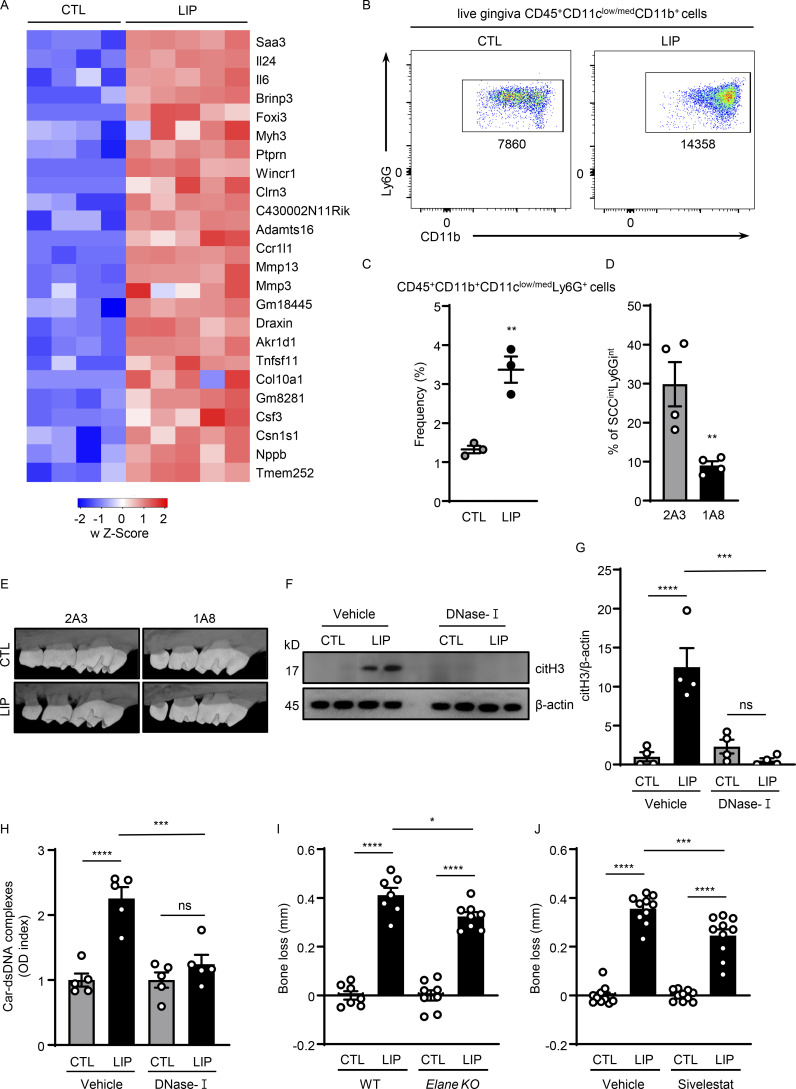
Figure S1.
NETs play a pathogenic role in inflammatory bone loss. (A) Mouse gingival tissues of CTL (n = 4) and LIP (n = 5, 5 d) were harvested, and processed for RNA-seq analysis. Heatmap analysis of the RNA-seq data. Significantly differentially expressed genes between CTL and LIP are shown. Each column represents an individual sample. (B and C) Flow cytometry analysis of mouse oral gingival tissues in CTL and LIP (n = 3, 5 d) mice. FACS plot shows changes in neutrophil numbers (B) and graph indicates percentage of CD45+CD11b+ CD11clow/medLy6G+ cells (C). (D) Percentage of neutrophils in gingival tissue after 1A8 (n = 4) or 2A3 (n = 4) treatment. (E) Representative microcomputed tomography images of maxilla from isotype control-treated and anti-Ly6G-treated mice (n = 3). (F–H) Gingival tissues with or without LIP (18 h) in mice treated with DNase-I (n = 4–5) or vehicle (n = 4–5) were harvested, processed, and then subjected to (F and G) immunoblot for citH3 and (H) ELISA for Car–dsDNA complexes. (I and J) Bone loss measurements with or without LIP (6 d) in (I) WT and Elane KO (n = 7–8) mice or (J) mice treated with sivelestat or vehicle (n = 10). Bar graph depicts bone loss. Data are representative of three (C, D, and H) or four (F, G, I, and J) independent experiments. Graphs show the mean ± SEM. * P <0.05, **P < 0.01, ***P < 0.001, ****P < 0.0001. One-way ANOVA with Tukey’s multiple comparison test (G–J), unpaired t test (C and D). Source data are available for this figure: SourceData FS1.

