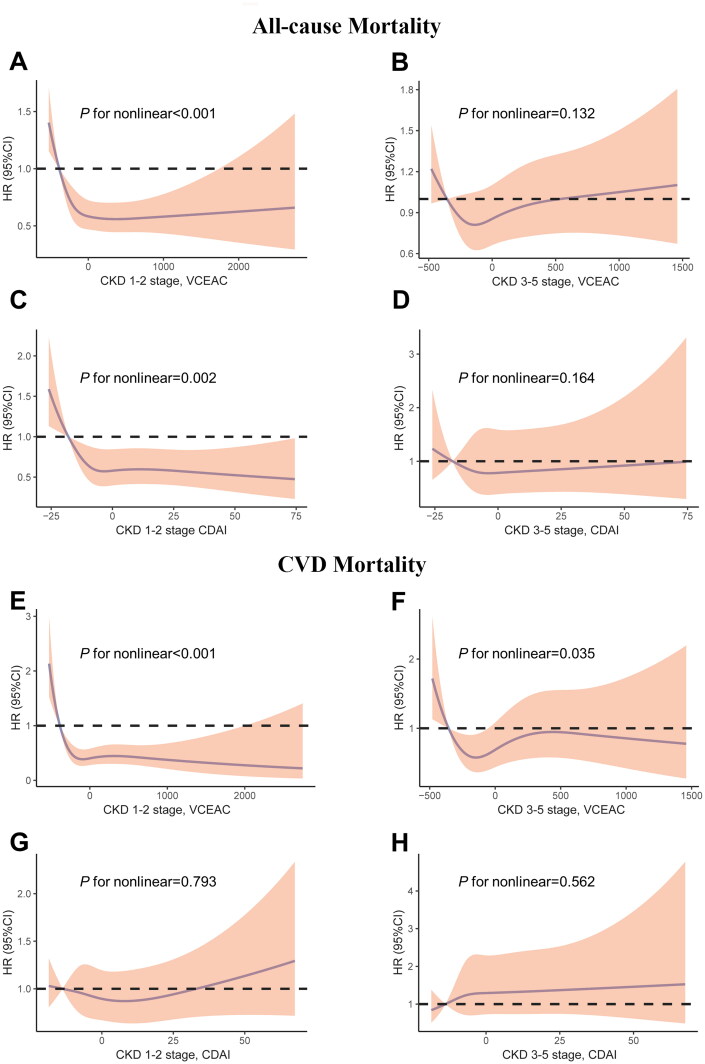
Figure 2.
Restricted cubic spline models for the relationship between dietary total antioxidant capacity with all-cause (top) and CVD (bottom) mortality. (A) CKD 1–2 stage, VCEAC and all-cause mortality. (B) CKD 3–5 stage, VCEAC and all-cause mortality (C) CKD 1–2 stage, CDAI and all-cause mortality. (D) CKD 3–5 stage, CDAI and all-cause mortality (E) CKD 1–2 stage, VCEAC and CVD mortality. (F) CKD 3–5 stage, VCEAC and CVD mortality. (G) CKD 1–2 stage, CDAI and CVD mortality. (H) CKD 3–5 stage, CDAI and CVD mortality. Adjusted for age, sex, ethnicity, income, education level, potassium intake, protein intake, carbohydrate intake, dietary fiber intake, total fat intake, alcohol intake, total energy intake via the residual method, smoking, MET-PA, diabetes, hypertension, CVD and cancer, urine albumin, eGFR, and BMI. The first quartile of VCEAC/CDAI was used as reference as it yields a hazard ratio of 0. The first and last knots were placed at the 0.01 quantile and 0.99 quantile of DTAC. Shading indicates the 95% confidence interval.

