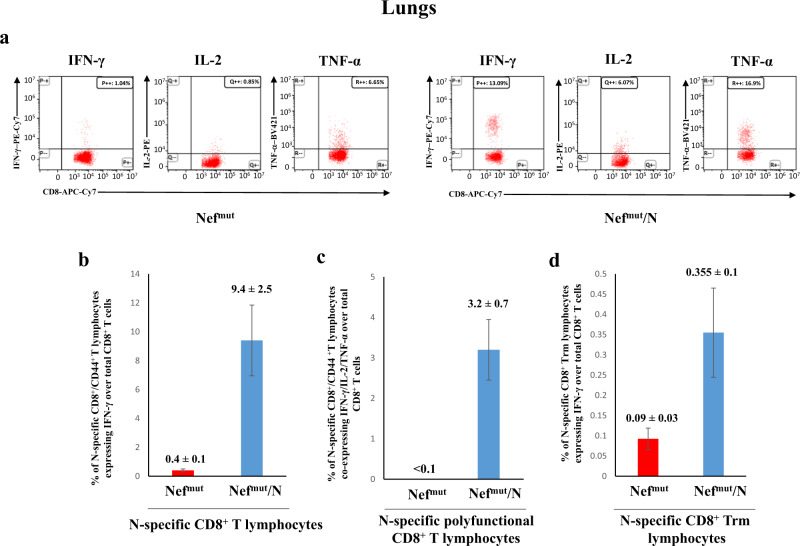
Fig. 3. Detection of SARS-CoV-2-N-specific CD8+ T lymphocytes in cultures of cells isolated from lungs of K18-hACE2 mice i.m. injected with either Nefmut- or Nefmut/N- expressing DNA vectors.
a Raw data from a representative ICS/flow cytometry analysis for the detection of IFN-γ, IL-2, and TNF-α within the CD45- fraction of cells isolated from lungs. b Percentages of cells expressing IFN-γ over the total of CD8+/CD44+ T cells within lung cells pooled from three mice injected with the indicated DNA vectors. Shown are mean values ± SE of percentages of IFN-γ expressing cells from at least three pooled cell cultures treated with specific peptides after subtraction of values detected in cells treated with an unrelated peptide. c Percentages of cells simultaneously expressing IFN-γ, IL-2, and TNF-α over the total of CD8+/CD44+ T cells within lung immune cells pooled from three mice injected with the indicated DNA vectors. Shown are mean values of the percentages ±SE of cytokine expressing cells from pooled cell cultures treated with the N peptide after subtraction of values detected in cultures treated with an unrelated peptide. d Percentages of CD8+ Trm cells (i.e., CD49a+, CD69+, CD103+) expressing IFN-γ over the total of CD8+/CD44+ T lymphocytes. Shown are mean value of percentages of positive cells from pooled cell cultures treated with the N peptide after subtraction of values detected in cultures treated with an unrelated peptide. Error bars, s.e.m.

