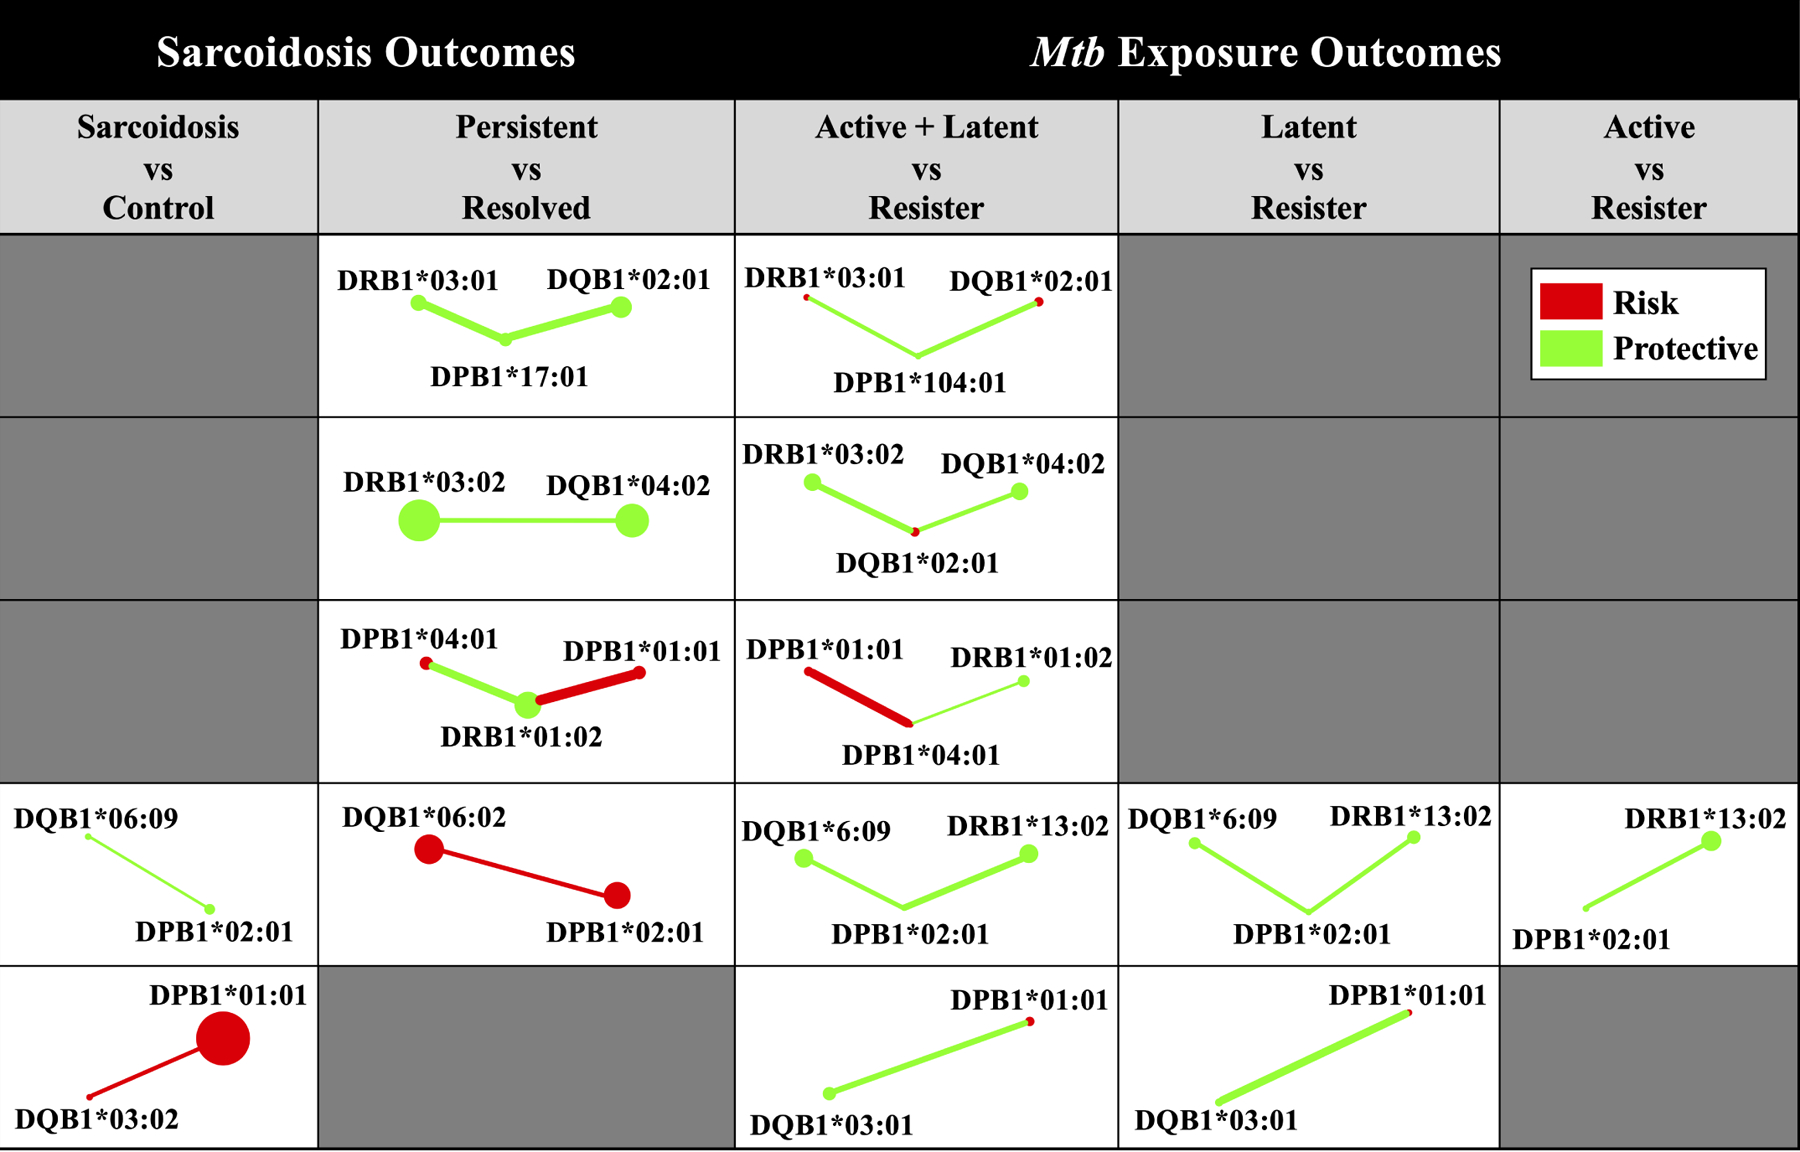
Figure 2. Interaction subnetwork similarities for Mtb exposure and sarcoidosis outcomes.

Subnetworks present were extracted from reGAINs for each Mtb exposure (Supplementary Figures S3 – S5) and sarcoidosis (Supplementary Figures S6 – S7) outcome. Each subnetwork includes only those interactions that were nominally significant (P < 0.05) and involving alleles detected by NPDR (Supplementary Tables S3 – S4). Node color corresponds to the adjusted odds ratio in the absence of non-additive effects, indicating whether the allelic odds ratio was protective (green, 0 < OR < 1) or predisposing (red, OR > 1) for a given disease sub-phenotype. Edge color corresponds to the interaction effect odds ratio for a given pair of adjacent alleles, similarly indicating whether the interaction effect odds ratio was protective (green, 0 < OR < 1) or predisposing (red, OR > 1) for a given disease sub-phenotype. Node size and edge width not drawn to scale.
