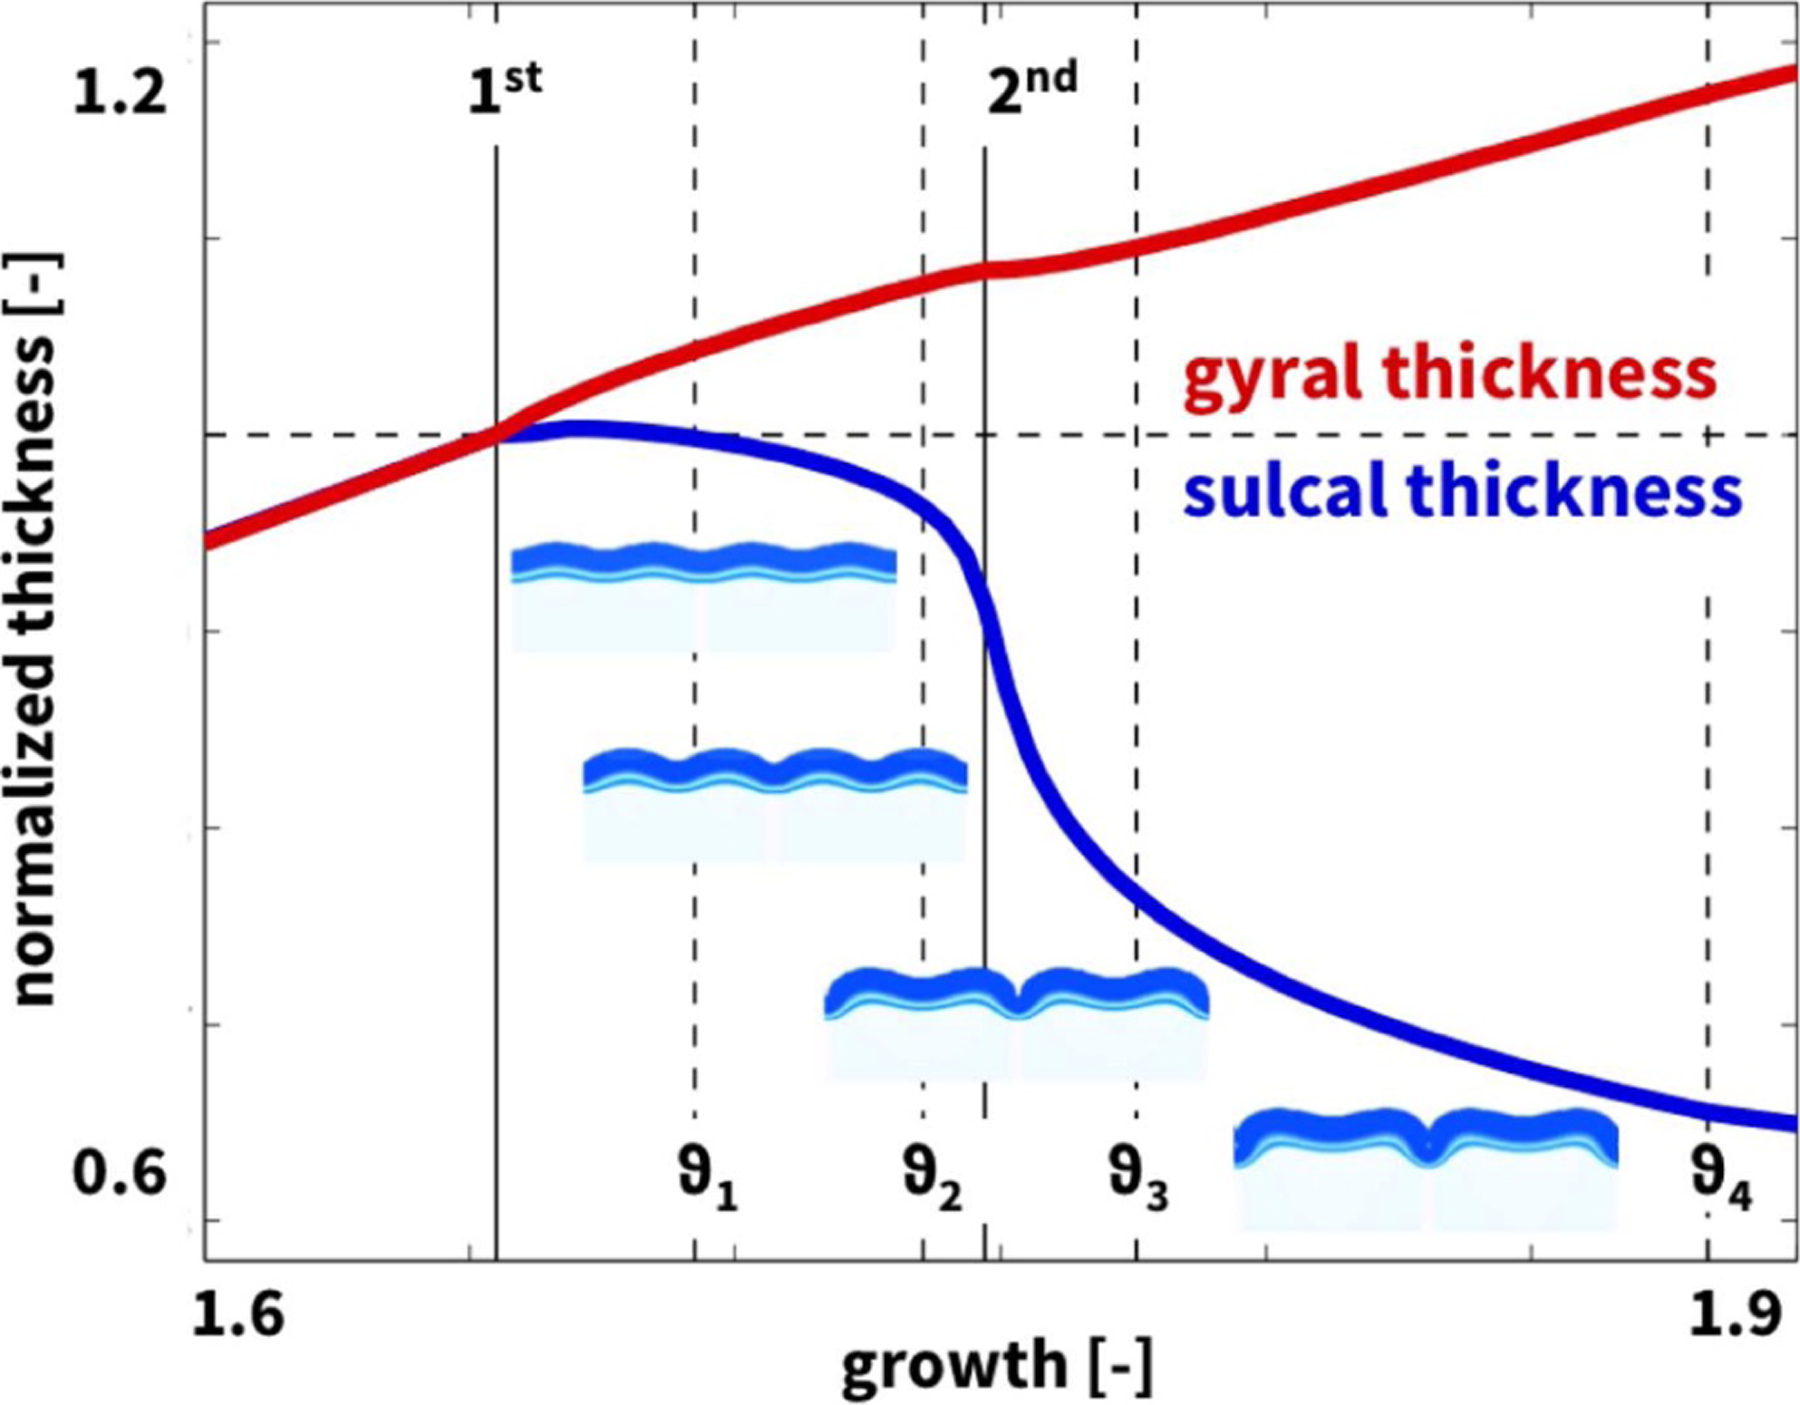
Fig. 12.

Thickness variations in computational model. Emerging normalized gyral (red) and sulcal (blue) thicknesses after first bifurcation at a layer growth of ϑ = 1.655 and second bifurcation at ϑ = 1.747 (solid lines); ϑ1 = 1.692, ϑ2 = 1.735, ϑ3 = 1.776, and ϑ4 = 1.883 (dashed lines) correspond to the time points in Figure 11.
