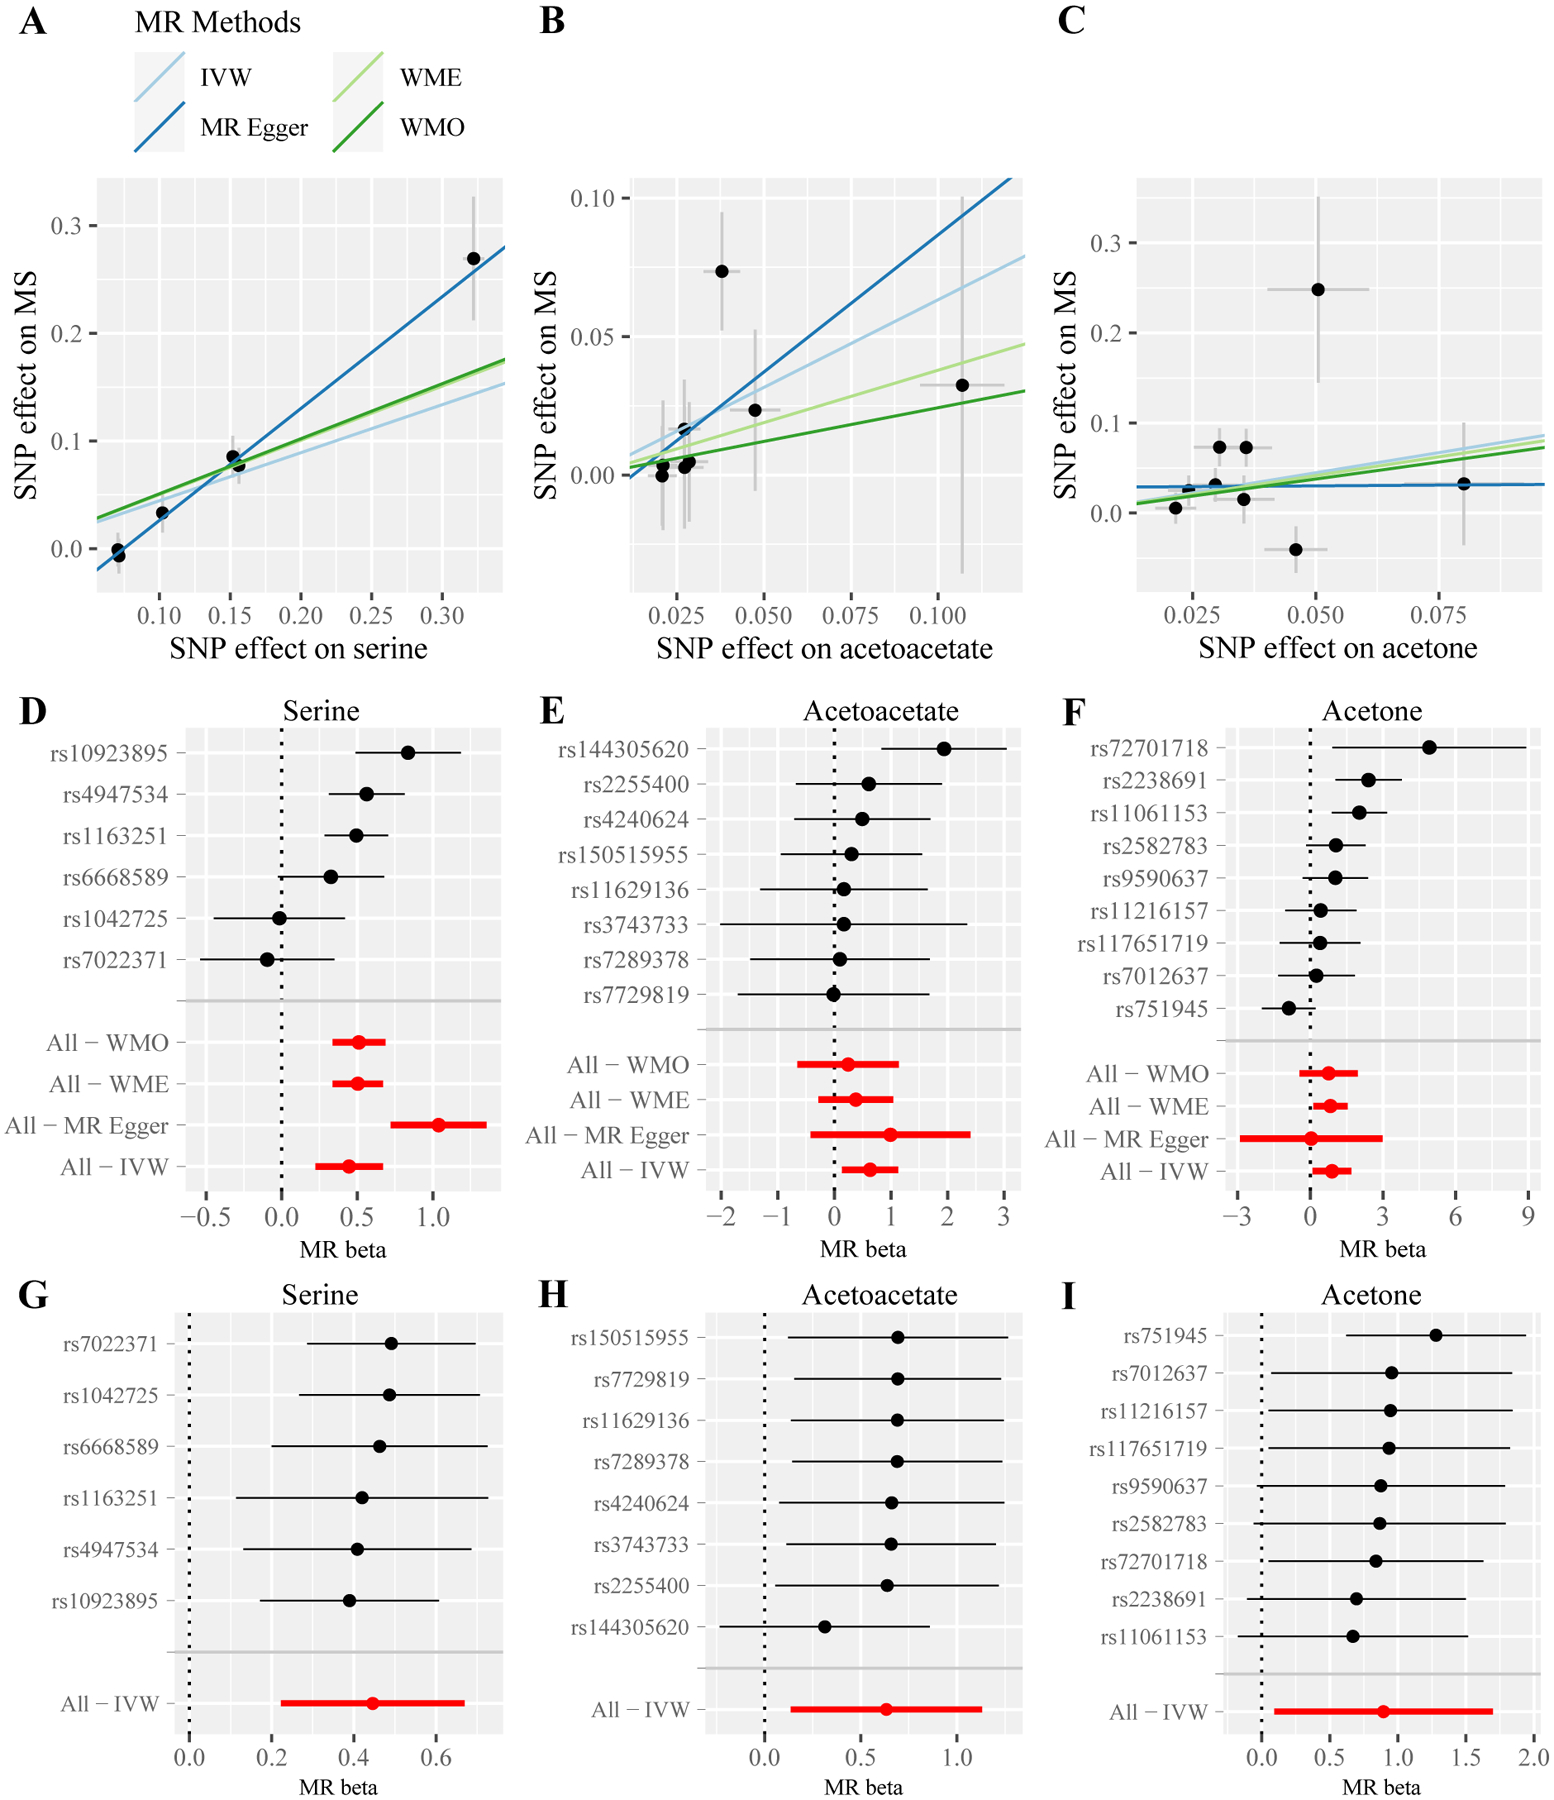
Fig. 3.

MR estimated effects of three metabolites on MS. Scatter plots for serine (A), acetoacetate (B), and acetone (C) illustrate the individual SNP effects on the metabolite and MS and the estimated linear causal relationship between the metabolite and MS by applying four MR methods. Forest plots for serine (D), acetoacetate (E), and acetone (F) show the causal effect estimates based on individual SNPs and based on all SNPs using four MR methods. Leave-one-out plots for serine (G), acetoacetate (H), and acetone (I) evaluate whether any SNP is driving the causal effect. MR: Mendelian randomization; MS: multiple sclerosis; IVW: inverse variance-weighted; WME: weighted median; WMO: weighted mode; SNP: single nucleotide polymorphism.
