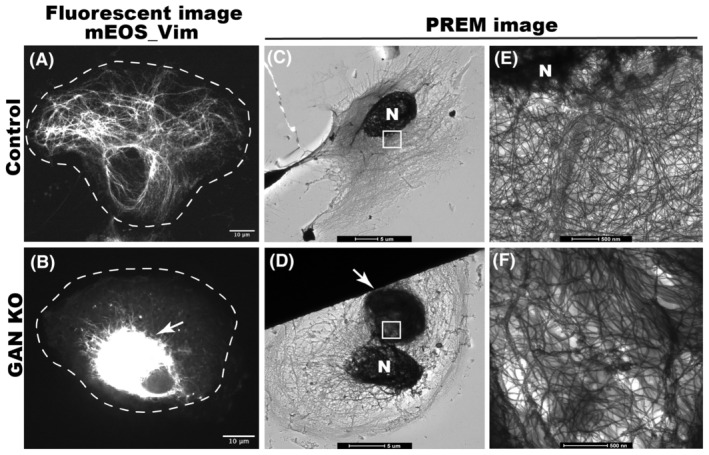
FIGURE 1.

GAN KO affects organization of IFs. (A) shows the normal distribution of mEOS_vim in control RPE cell, (B) shows the mEOS_vim aggregation in GAN KO RPE cells. Scale bar 10 micrometers. Platinum replica electron microscope (PREM) images of control cell (C, E) and GAN KO cell (D, F). IF meshwork in the entire cell can be appreciated in lower magnification (C) and single filaments can be observed in higher magnification near nucleus (E). In GAN KO cells, juxtanuclear IF aggregates can be observed at lower magnification (D), single filaments can be observed in the IF aggregate at higher magnification of aggregated region (F). Nucleus is indicated by N, arrow points to IF aggregates and white box in C and D represent the magnified region for E and F respectively. Scale bar 5 μm for C and D; 500 nm for E and F images.
