
FIGURE 5.
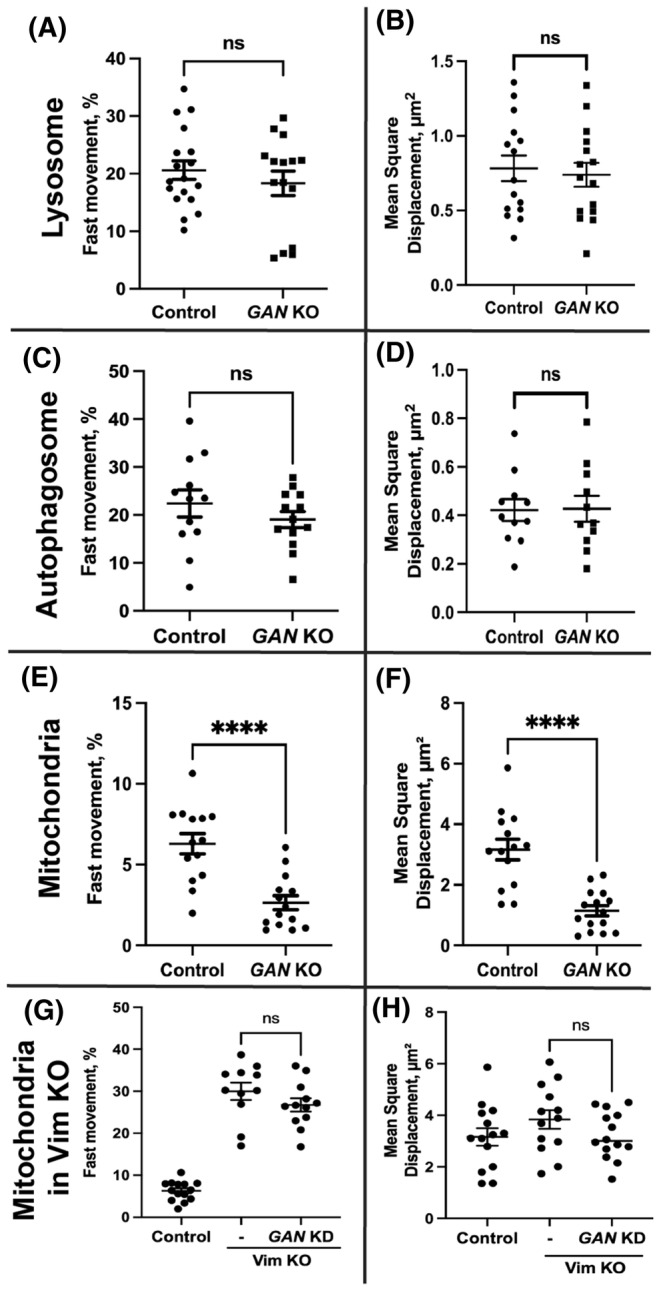
Membrane organelle motility under GAN KO and GAN KD. Lysosomes were visualized in live cell using lysotracker red. Panel (A) and (B) depict the fast movement and mean square displacement of lysosomes in control and GAN KO cells respectively. Autophagosomes were visualized in live cell using the autophagosome‐specific marker LC3 tagged with mCherry. Panel (C) and (D) depict the fast movement and mean square displacement of autophagosomes. Both lysosome and autophagosome motility are not affected in GAN KO cells. Mitochondria were visualized in live cell using Mitotracker red. Panel E shows that the fast mitochondrial movement is severely affected in GAN KO cells compared to control cells. (F) Mean square displacement of mitochondria in GAN KO is significantly lower than control cells. Silencing GAN expression in Vim KO cell has no effect on mitochondrial motility (G) and mean square displacement (H). Statistical significance was determined using Student's t‐test (n = 15 cells). ****p < .0001.