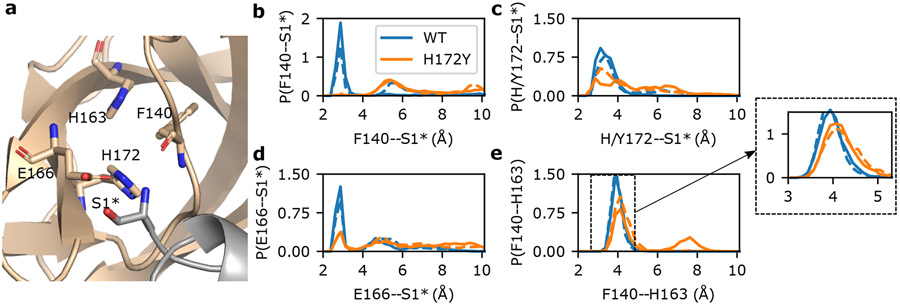
Figure 2: N-terminus interactions with the S1 pocket are destabilized in the simulations of the free H172Y Mpro.
a. Visualization of the interactions between the S1 pocket and N-terminus* (Ser1*) of the opposite protomer in the WT Mpro. Phe140, His163, Glu166, His172, and Ser1* are shown as sticks. b,c,d. Probability distributions of distances between Phe140 (b), Glu166 (c), or His/Tyr172 (d) and Ser1* from the WT and H172Y Mpro simulations. For each Mpro, all three trajectories were used with the first 1μs of each trajectory discarded. In b and c, distance was calculated from the N-terminal nitrogen of Ser1* to the backbone carbonyl oxygen of Phe140 (b) or the nearest carboxylate oxygen of Glu166 (c). In d, distance was calculated from the backbone carbonyl oxygen of Ser1* to the nearest imidazole nitrogen of His172 (WT) or from the N-terminal nitrogen of Ser1* to the hydroxyl oxygen of Tyr172 (H172Y). Interactions of S1 pocket(A) with N-terminus(B) are shown as solid lines and those of S1 pocket(B) with N-terminus(A) are shown as dashed lines. Similar disruption/destabilization was observed in the simulations of the nirmatrelvir-bound Mpro (Fig. S10 and S11).

