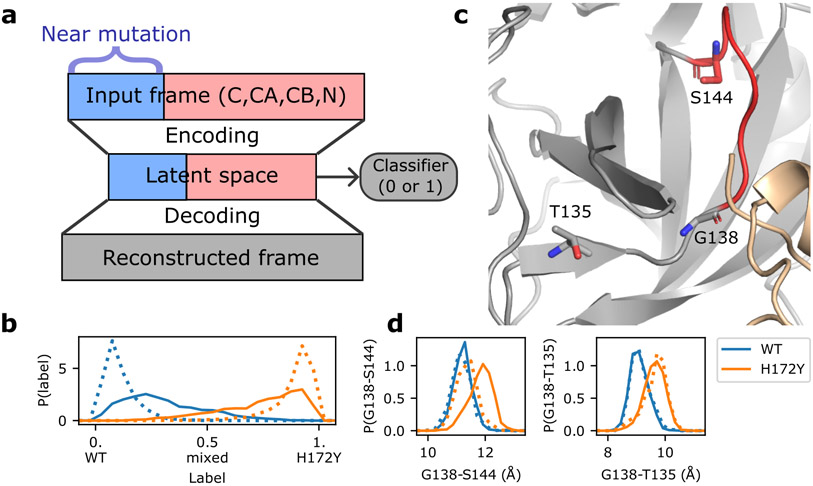
Figure 5:
Artificial neural network detects mutation-induced conformational changes to the oxyanion loop. a. Schematic architecture of the autoencoder DiffNets26. which was used to detect differences between protein structures from two trajectories. b. Classification (WT vs. H172Y) of the free (dotted) and ligand-bound (solid) trajectories. The three free and two ligand-bound WT (blue) or H172Y (brown) trajectories were aggregated. c. Zoomed-in view of the oxyanion loop (red, residues 138–145; among them 143–145 form the oxyanion hole) and the three residues (licorice) involved in the important distances (Gly138-Ser144 and Gly138-Thr135) that distinguish between the WT and H172Y trajectories (i.e., highly correlated with the predicted labels). The oxyanion hole is comprised of Gly143, Ser144, and Cys145. d. Probability distributions of the Cα distances from Gly138 to Ser144 (left) and Thr135 (right) from the free (dotted) or ligand-bound (solid) WT (blue) and H172Y (brown) Mpro trajectories. The aggregate trajectories including both protomers were used. Data for individual trajectories and protomers as well as other distances involving Gly138 are given in Figures S14 and S15.

