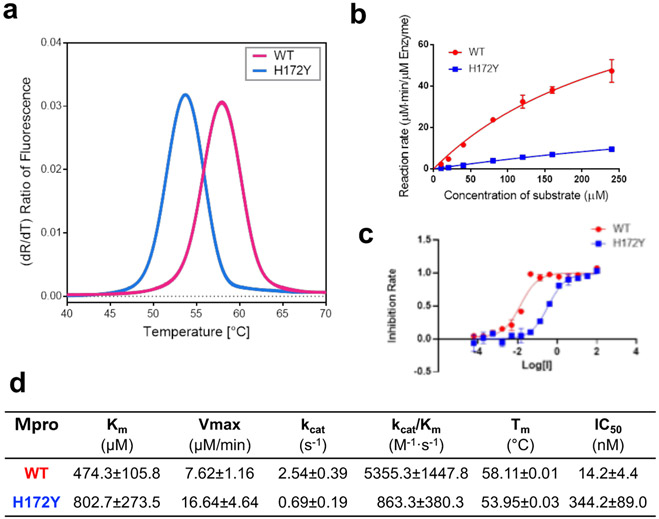
Figure 6: H172Y Mpro has reduced thermal stability, enzyme activity, and susceptibility to nirmatrelvir as compared to the WT.
a. Melting curves of the WT (red) and H172Y (blue) Mpros based on the temperature profile of the first derivative of the ratio of the autofluorescence at 350 and 330 nm. b. Reaction rate vs. substrate concentration for the WT (red) and H172Y (blue) Mpros using the FRET assay. c. Inhibition rate of nirmatrelvir vs. its concentration (μM) for the WT (red) and H172Y (blue) Mpros. d. Summary of the kinetic constants, melting temperatures of the Mpros, and the IC50 values of nirmatrelvir.

