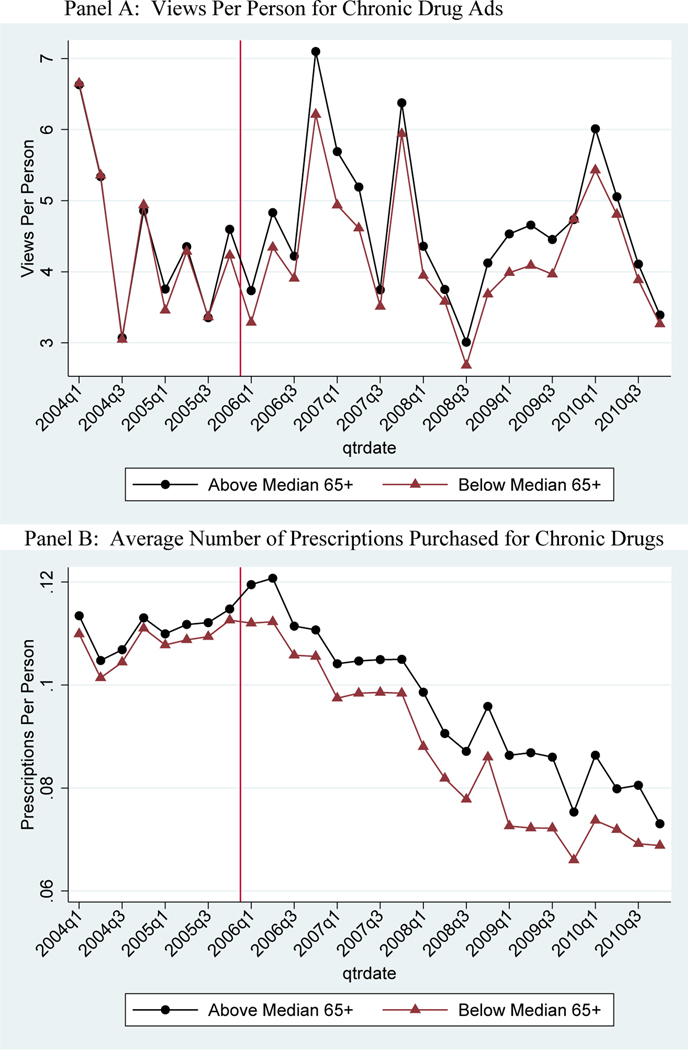
Figure 3 – Quarterly Views per Person of TV Ads and Mean Utilization of Chronic Drugs, for Non-Elderly.
Notes: Sample means from Nielsen Ad*Views (views per capita for non-elderly) and claims (mean number of total prescriptions purchased for non-elderly) in above median elderly share markets relative to below median elderly share markets. Includes the 50 drugs that advertised during the study period for 5 chronic conditions: depressions, diabetes, hyperlipidemia, hypertension, and osteoporosis. The vertical line represents the implementation date of Medicare Part D.

