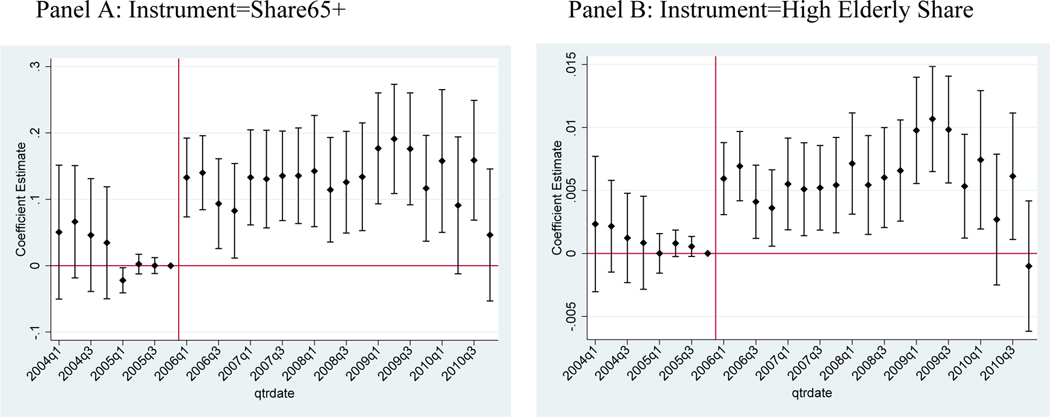
Figure 4 – Event Study: Total Utilization of Chronic Drugs, Non-Elderly.
Notes: Event study coefficients and 95% confidence intervals. Clustered standard errors at the 3-digit ZIP code level. The outcome variable is the number of prescriptions. The event study is similar to Equation 3, but Panel A interacts quarter fixed effects with the Share65+ variable (continuous instrument) and Panel B interacts quarter fixed effects with the High Elderly Share indicator (binary instrument). All specifications include quarter fixed effects, 3-digit ZIP code fixed effects, condition fixed effects. Estimates are normalized to zero in quarter 4 of 2005. Includes the 50 drugs that advertised during the study period for 5 chronic conditions: depression, diabetes, hyperlipidemia, hypertension, and osteoporosis.

