
Figure 3.
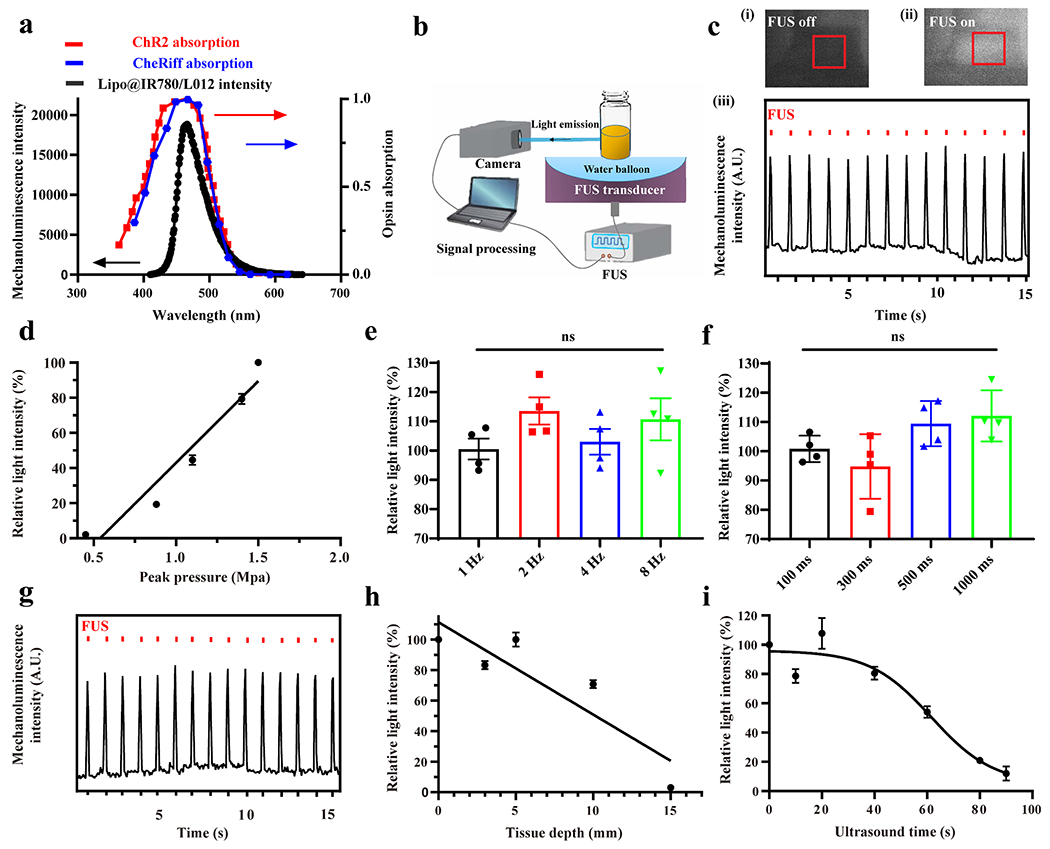
FUS-triggered light emission of Lipo@IR780/L012. (a) Mechanoluminescence spectrum of Lipo@IR780/L012 nanoparticles (black) overlaid with the ChR2 absorption spectrum (red dotted curve) and CheRiff absorption spectrum (blue dotted curve); (b) illustration of the FUS-induced light emission of Lipo@IR780/L012 nanoparticles and signal processing; (c) blue light was generated from Lipo@IR780/L012 nanoparticles under FUS irradiation (1.5 MHz, pulse 100 ms on, 900 ms off, 1 Hz, 1.5 MPa): photography of Lipo@IR780/L012 nanoparticles when the FUS was (i) off and (ii) on and (iii) 470 nm blue light emission from Lipo@IR780/L012 nanoparticles under the repetitive FUS irradiation; (d) quantification analysis of light density indicating that the light emission of Lipo@IR780/L012 nanoparticles increases linearly with FUS peak pressure; (e) Lipo@IR780/L012 nanoparticles light emission intensity under different FUS irradiation frequencies [n = 4 per group, one-way analysis of variance (ANOVA)] (1.5 MHz, 1.5 MPa); (f) Lipo@IR780/L012 nanoparticles light emission intensity under different pulse intervals (n = 4 per group, one-way ANOVA) (1.5 MHz, 1.5 MPa); (g) blue light emission from Lipo@IR780/L012 nanoparticles upon FUS irradiation under 10 mm pork skin (1.5 MHz, pulse 100 ms on, 900 ms off, 1 Hz, 1.5 MPa); (h) quantification analysis of light density at different pork skin depths (1.5 MHz, pulse 100 ms on, 900 ms off, 1 Hz, 1.5 MPa) under FUS irradiation; and (i) light density of Lipo@IR780/L012 nanoparticles decayed with continuous FUS irradiation. All plots show mean ± SEM unless otherwise mentioned. *P < 0.05, **P < 0.01, ***P < 0.001, and ****P < 0.0001; ns, not significant.