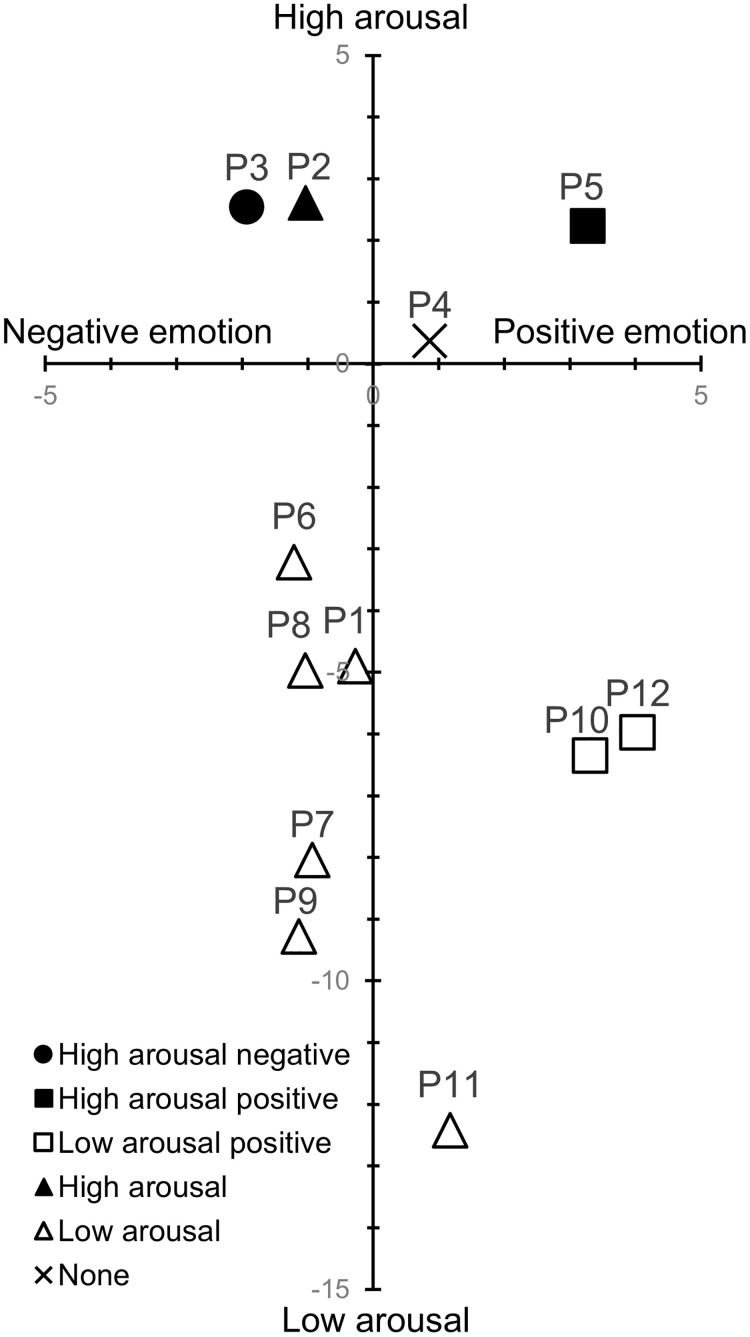
Fig 2. 2-D plot of TDMS arousal and valence for each posture in Experiment 1.
The markers reflect the results of a one-sample t-test. Filled and white markers indicate the postures that led to high and low arousal, respectively. Square and circle represent the postures that led to positive and negative emotions, respectively. Triangles indicate postures that had an effect only on arousal, and cross marks indicate postures that had no effect on both arousal and valence.

