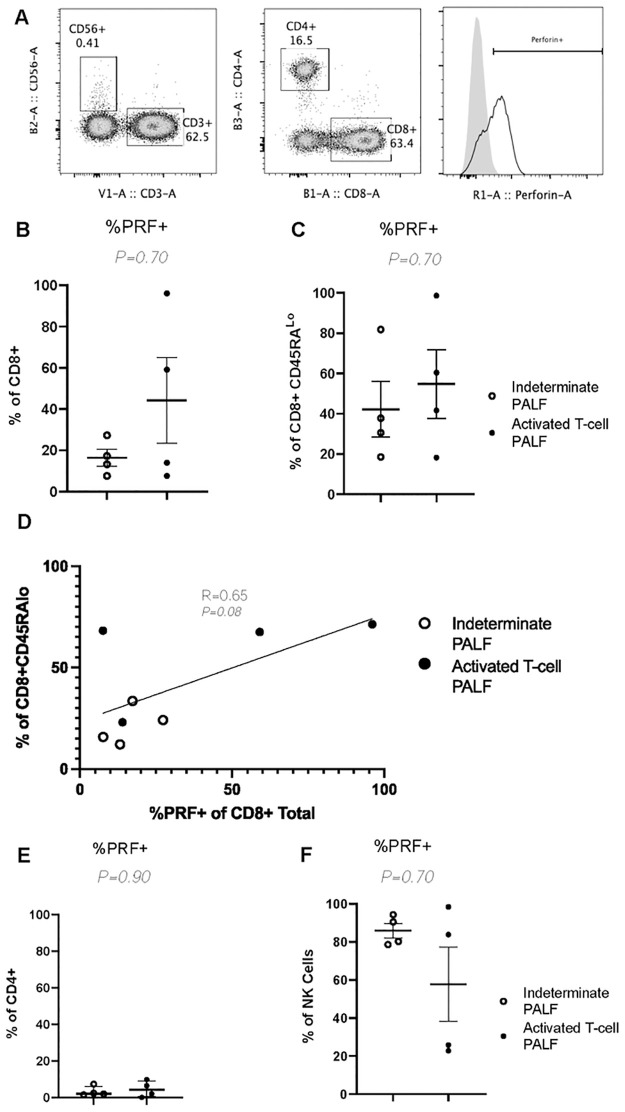
Fig 4. Lymphocyte perforin staining does not help distinguish activated T-cell PALF from indeterminate PALF.
(A) Example of gating strategy of percent perforin positive (%PRF+) from CD8+ T-cells (Lymphocytes, Live, CD3+, CD56-, CD8+, CD4-). Grey histogram depicts isotype and clear histogram perforin staining. (B-C) Quantification of %PRF+ cells from CD8+ (B), CD8+ CD45RALo (C). (D) Linear regression of %PRF+ CD8+ T cells to total percent of CD8+CD45RALo cells with correlation coefficient and significance (P-value) embedded in graph. Quantification of %PRF+ cells from CD4+ (E) and NK Cells (F) with results quantified as mean ± SEM. Symbols denote individual patient samples.

