
FIGURE 4.
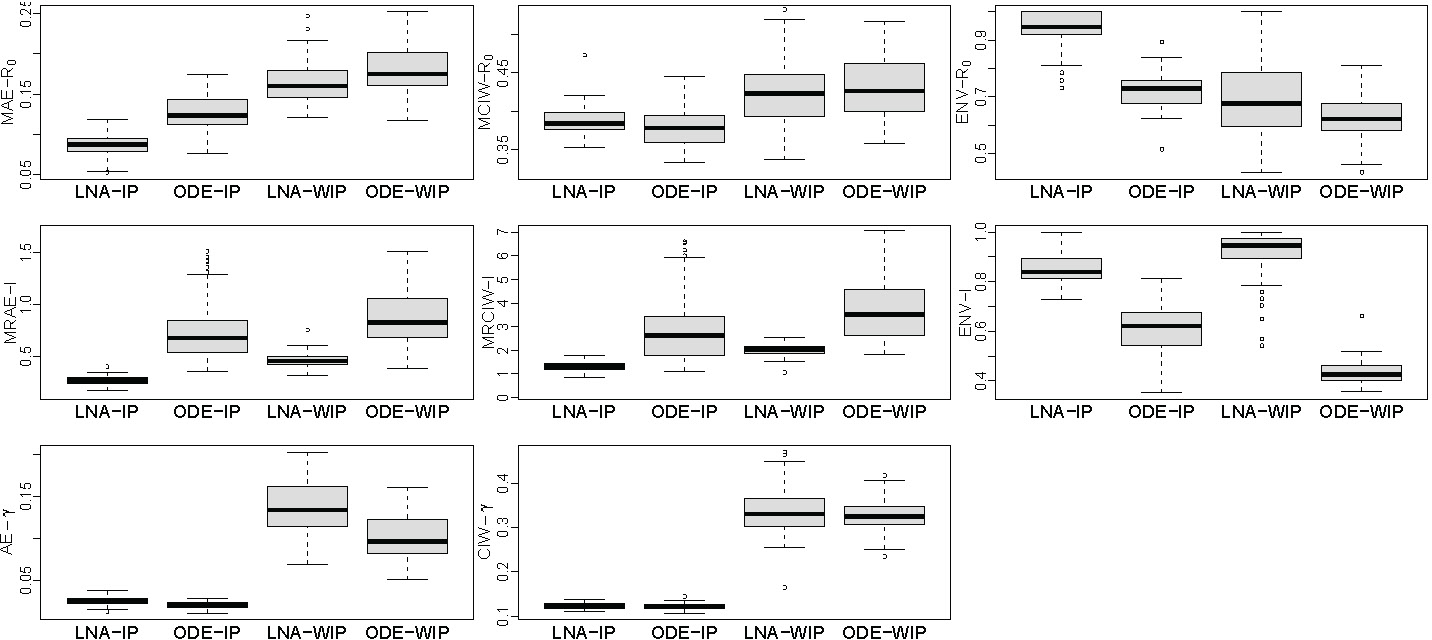
Borplots comparing performance of LNA-based and ODE-based methods using 100 simulated genealogies under informative prior (IP) and weakly informative prior (WIP) for removal rate . The first row shows mean absolute error (MAE), mean credible interval width (MCIW), and enevolope trajectory. The second row depiets mean relative absolute error (MRAE), mean relative credible interval width (MRCIW), and enelope (ENV-1) for (prevalence) trajectory (ENV-I). The last two plots show the absolute error (AE) and Bayesian credible intereval (BCI) width for .