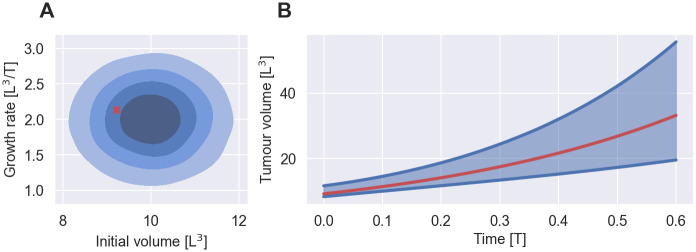
Fig 1. NLME model of early cancer growth.
A: Shows the population model, p(ψ|θ), for θ = (10, 1, 2, 0.5) in shades of blue and the parameters of a randomly chosen individual in red. The shades of blue indicate the bulk 20%, 40%, 60% and 80% probability of the distribution. B: Shows the distribution of tumour volumes across individuals in the population, p(y|θ, t), in blue and the tumour volume of a randomly chosen individual over time in red. The blue lines indicate the 5th and 95th percentile of the tumour volume distribution at each time point. The quantities are shown in arbitrary units. L denotes length dimensions and T denotes time dimensions.

