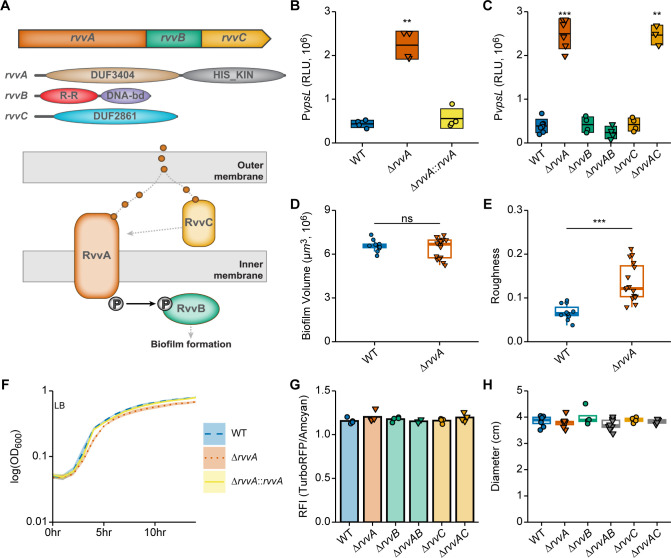
Fig 2. Rvv contributions to biofilm formation and biofilm-associated cellular processes in V. cholerae.
(A) Depiction of the genomic region surrounding rvvA (VCA0257) (top), the predicted domains of each protein in RvvABC (middle), and putative model of Rvv interactions based on predicted function and cellular localization (bottom). (B–C) Promoter activity of the transcriptional fusion PvpsL-lux was measured from cells grown to exponential phase in the indicated strains. Individual data points (circles–RvvA present; triangles–RvvA deleted) of Relative Luminescent Units (RLU) are plotted with crossbars representing mean and standard deviation. Statistical significance was determined using a One-Way ANOVA and post-hoc Tukey’s multiple comparisons test. Means from individual biological replicates (n ≥ 3) were compared to that of wild type, and differences with an adjusted P value of ≤ 0.01 were deemed significant. **, P ≤ 0.001; ***, P ≤ 0.0001. (D-E) Static biofilms of gfp-tagged WT and ΔrvvA strains were grown in LB for 6 hours at 30°C and imaged with confocal laser scanning microscopy (CLSM). Biofilm biovolume (D) and biofilm roughness (E) of WT and ΔrvvA static biofilms was measured using the quantitative image analysis software BiofilmQ. Means from at least three biological replicates were compared by an unpaired t-test, and mean differences with a P value of ≤ 0.01 were considered significant. ***, P ≤ 0.001; ns, not significant. (F) Growth curves of WT (blue), ΔrvvA (orange), and the complemented rvvA deletion strain ΔrvvA::rvvA (yellow) in LB medium, 30°C. (G) c-di-GMP levels were measured from cells grown to exponential phase in the indicated strains using the Bc3-4 c-di-GMP biosensor. Relative Fluorescence Intensity (RFI) was measured as TurboRFP / Amcyan (normalizer). (H) Single colonies of indicated strains were inoculated in 0.3% agar plates. Swimming motility was measured by diameter (cm) surrounding inoculum position after 16 hours of incubation. n ≥ 4.

