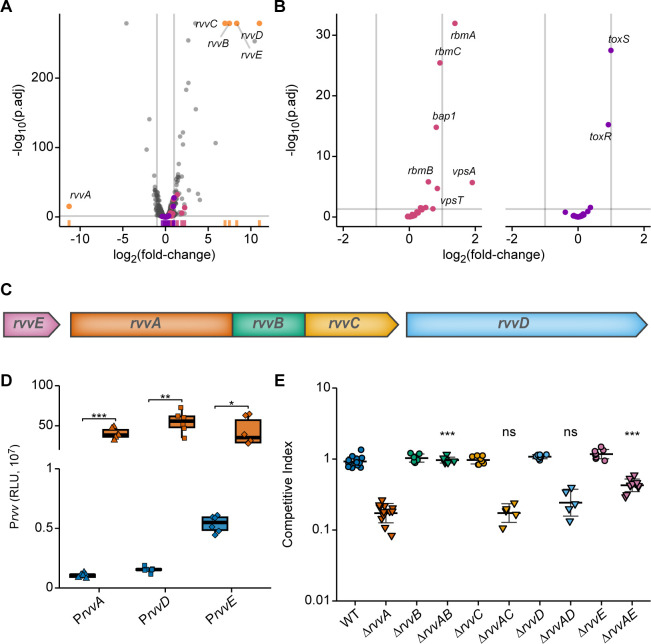
Fig 6. Rvv regulon and its contribution to virulence.
(A) RNA-seq analysis of ΔrvvA and wild-type strains grown under virulence-inducing conditions (AKI). Volcano plots display differential transcript abundance in ΔrvvA compared to wild type (n = 3). The negative log of the adjusted p-value (base 10) is plotted on the y axis, and the log of the fold-change (FC) (base 2) is plotted on the x axis. Each point represents a transcript. Gray lines indicate cutoffs for differential expression–a log2 FC with an absolute value greater than 1 (vertical lines), and an adjusted p-value less than 0.05 (horizontal line). A log2(fold change) > 0 indicates increased expression of a transcript in ΔrvvA compared to wild type. Differential coloring is used for transcripts of genes involved in biofilm formation (pink), pathogenesis (purple), or comprising the rvv loci (orange-yellow). A marginal distribution runs along the x-axis depicts the density of transcripts from a given pathway within the plot. (B) Volcano plots with subsets of the data shown in (A), displaying only transcripts of genes involved in biofilm formation (pink) and pathogenesis (purple). (C)—Genomic region representing rvvABCDE loci (VCA0258-VCA0254). (D)—Promoter activity of Prvv-lux transcriptional fusions from upstream regulatory regions of rvvA (triangles), rvvD (squares), and rvvE (diamonds) was measured from exponentially grown cells in wild type (blue) and ΔrvvA (orange). Individual data points of Relative Luminescence Units (RLU) are overlaid on top of crossbars displaying the mean and standard deviation. For each transcriptional fusion, means from at least three biological replicates were compared by an unpaired t-test. *, P ≤ 0.01; **, P ≤ 0.001; ***, P ≤ 0.0001. (E)–The competitive index (CI) of indicated strains to colonize the infant mouse intestine were analyzed using a competition assay with an isogenic wild-type strain. Each data point represents the CI in an individual mouse. Statistical significance was determined using a One-Way ANOVA and post-hoc Tukey’s multiple comparisons test. Means from individual biological replicates (n ≥ 6) were compared to that of ΔrvvA, and differences with an adjusted P value of ≤ 0.01 were deemed significant. ***, P ≤ 0.0001; ns, not significant.

