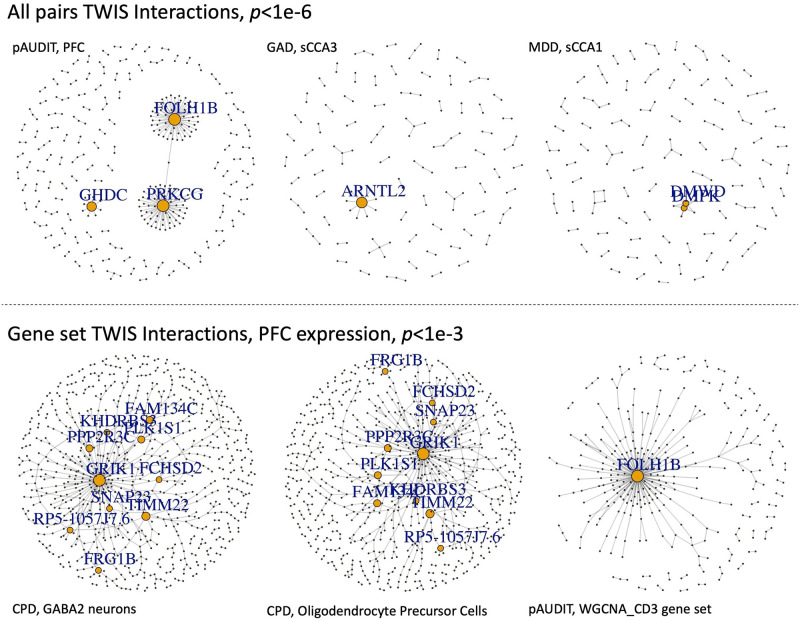
Fig 3. Networks of TWIS associations for selected traits and gene expression in specific tissues, either based on all pairs with p<1e-6 from the exhaustive, genome-wide TWIS (top), or within specific gene sets applying a nominal p<1e-3 threshold (bottom).
P-value thresholds were chosen to best visualize clusters. Genes with degree≥5 are labeled, and size of points is proportional to node degree.

