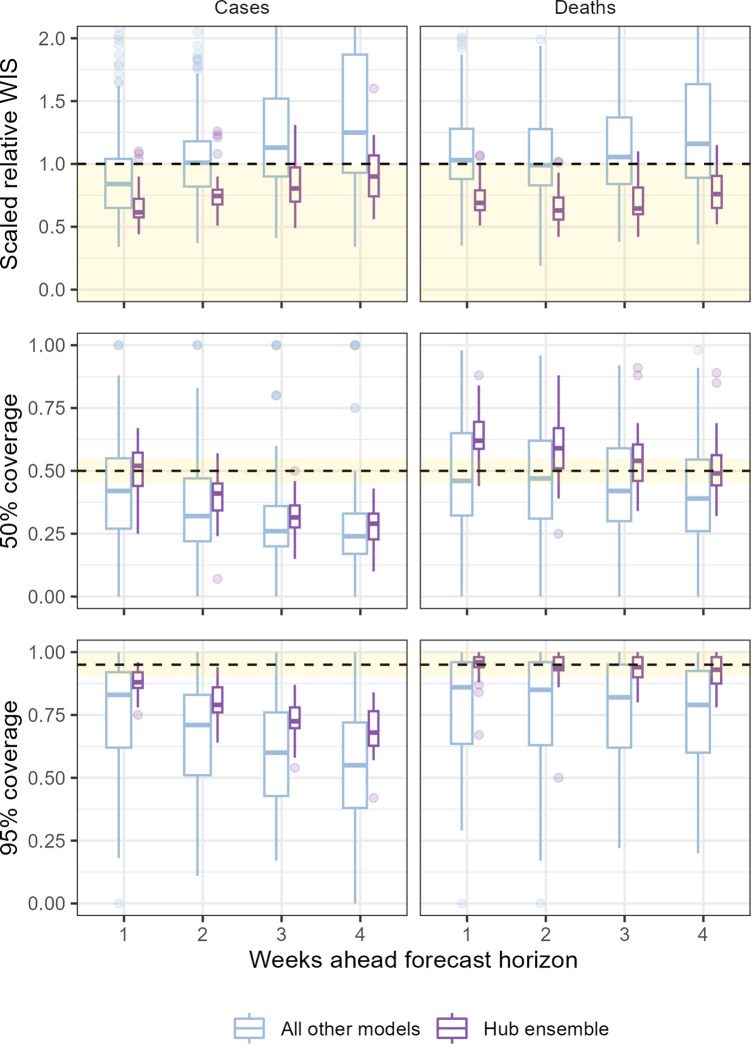
Figure 3. Performance of short-term forecasts aggregated across all individually submitted models and the Hub ensemble, by horizon, forecasting cases (left) and deaths (right).
Performance measured by relative weighted interval score scaled against a baseline (dotted line, 1), and coverage of uncertainty at the 50% and 95% levels. Boxplot, with width proportional to number of observations, show interquartile ranges with outlying scores as faded points. The target range for each set of scores is shaded in yellow.

