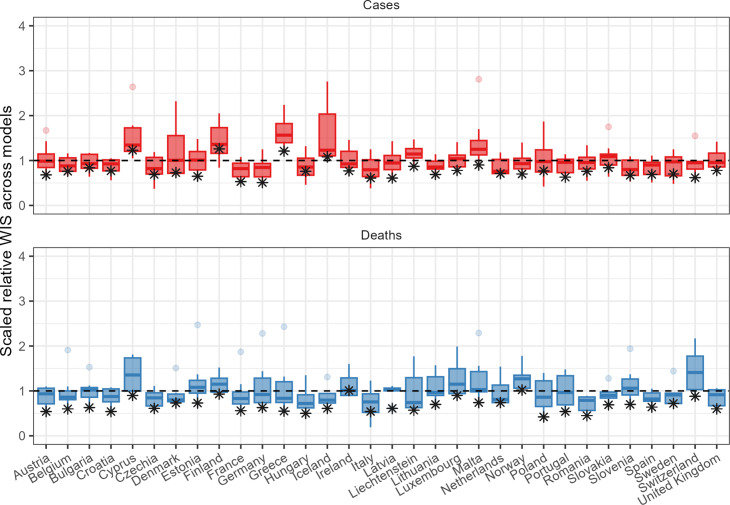
Figure 4. Performance of short-term forecasts across models and median ensemble (asterisk), by country, forecasting cases (top) and deaths (bottom) for 2-week ahead forecasts, according to the relative weighted interval score.
Boxplots show interquartile ranges, with outliers as faded points, and the ensemble model performance is marked by an asterisk. y-axis is cut-off to an upper bound of 4 for readability.

