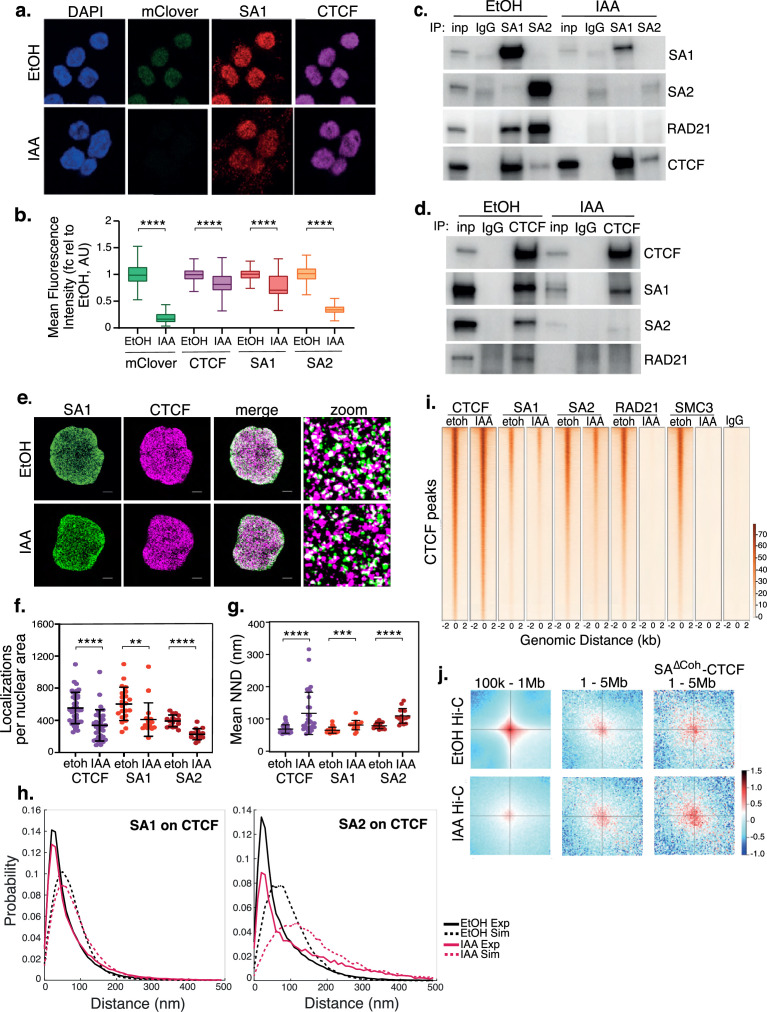
Figure 1. SA interacts with CTCF in the absence of cohesin.
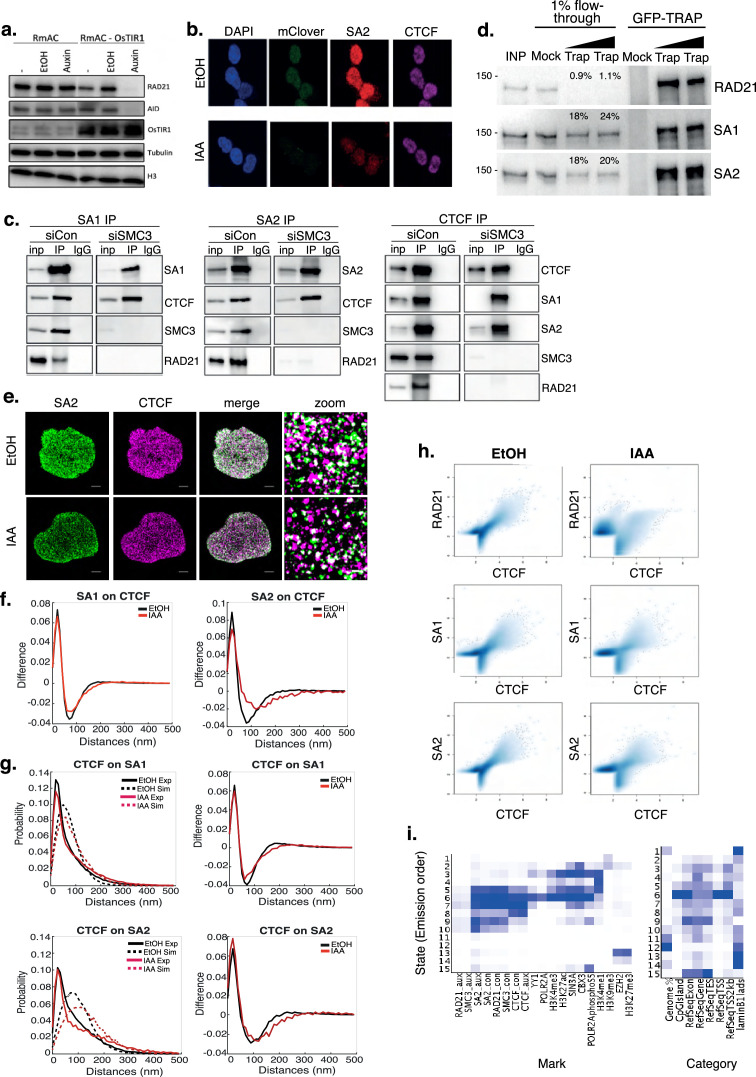
(a) Representative confocal images of SA1 and CTCF IF in RAD21mAC cells treated with ethanol (EtOH) as a control or Auxin (IAA) for 4 hr. Nuclei were counterstained with DAPI. (b) Imaris quantification of the relative mean fluorescence intensity (MFI) of mClover, CTCF, SA1 and SA2 in EtOH and IAA-treated RAD21mAC cells. Whiskers and boxes indicate all and 50% of values, respectively. Central line represents the median. Asterisks indicate a statistically significant difference as assessed using two-tailed t-test. **** p<0.0001. n>50 cells/condition from three biological replicates. Chromatin coIP of (c) SA1, SA2, and IgG with RAD21 and CTCF or (d) CTCF and IgG with RAD21, SA1, and SA2 in RAD21mAC cells treated with EtOH or IAA for 4 hr. Input represents (c) 2.5% and (d) 1.25% of the material used for immunoprecipitation. (e) Dual-color STORM images of SA1 (green) and CTCF (magenta) in EtOH and IAA-treated RAD21mAC cells. Representative full nuclei and zoomed nuclear areas are shown. Line denotes 2 microns and 200 nm for full nuclei and zoomed areas respectively. See figure supplements for SA2 STORM images. (f) Mean CTCF, SA1 and SA2 localization densities (localizations normalized with nuclear area) in EtOH and IAA-treated RAD21mAC cells (n = >30, >17, and>15 nuclei for CTCF, SA1, and SA2, respectively). Mean and SD are plotted, Mann Whitney test. ** p<0.005, *** p<0.0005, **** p<0.0001. (g) Mean Nearest Neighbor Distance (NND) of CTCF, SA1, and SA2 clusters in nanometers in EtOH and IAA-treated cells (n = >38, >14. and>23 nuclei for CTCF, SA1, and SA2, respectively). Mean and SD are plotted, Mann Whitney test. **** p<0.0001. (h) NND distribution plot of the distance between CTCF and SA1 (left panel) or SA2 (right panel) clusters in EtOH and IAA-treated cells. Experimental data are shown as continuous lines, random simulated data are displayed as dotted lines. (i) ChIP–seq deepTools heat map of CTCF, SA1, SA2, Rad21 and SMC3 binding profiles in control (EtOH) and IAA-treated RAD21mAC cells. Selected regions are bound by CTCF in control conditions. (j) Analysis of contact frequency hotspots from Hi-C libraries generated from EtOH-treated (top row) and IAA-treated (bottom row) RAD21mAC cells. Contact frequencies were calculated in two distance ranges of 100 kb – 1 Mb and 1–5 Mb. The last column includes contact frequencies specifically at SA-CTCFΔCoh binding sites.


