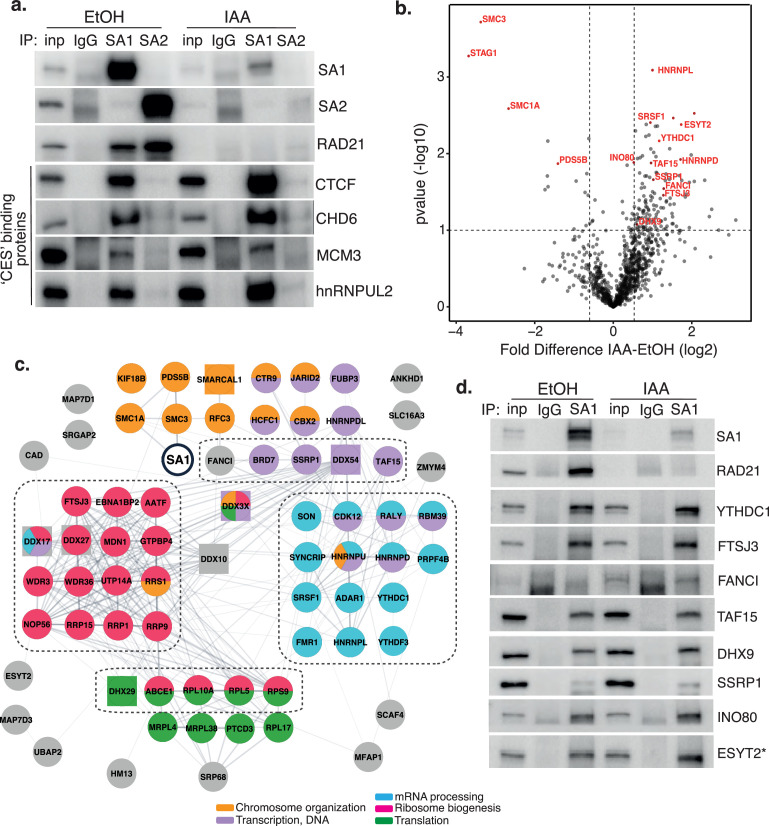
Figure 2. Characterization of SA1 protein-protein interaction network in RAD21-depleted cells.
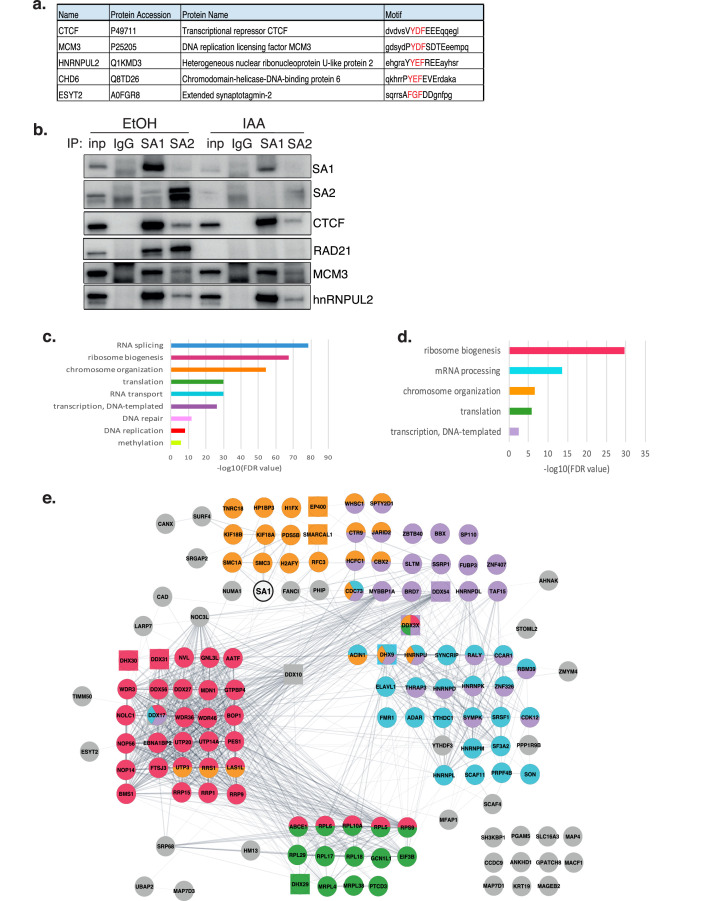
(a) Chromatin coIP of SA1, SA2, and IgG with four predicted CES-binding proteins in RAD21mAC cells treated with EtOH or IAA for 4 hr. Input represents 1.25% of the material used for immunoprecipitation. (b) Volcano plot displaying the statistical significance (-log10 p-value) versus magnitude of change (log2 fold change) from SA1 IP-MS data produced from untreated or IAA-treated RAD21mAC cells (n=3). Vertical dashed lines represent changes of 1.5-fold. Horizontal dashed line represents a pvalue of 0.1. Cohesin complex members and validated high-confidence proteins have been highlighted. (c) SA1ΔCoh interaction network of protein–protein interactions identified in RAD21mAC cells using STRING. Node colors describe the major enriched categories, with squares denoting helicases. Proteins within each enrichment category were subset based on p-value change in B. See figure supplements for full network. Dashed boxes indicate the proteins and categories which were specifically enriched in IAA-treatment compared to the SA1 interactome. (d) Chromatin IP of SA1 and IgG in RAD21mAC cells treated with EtOH or IAA and immunoblotted with antibodies to validate the proteins identified by IP-MS. Input represents 1.25% of the material used for immunoprecipitation. * We note that ESYT2 is a F/YXF-motif containing protein.


