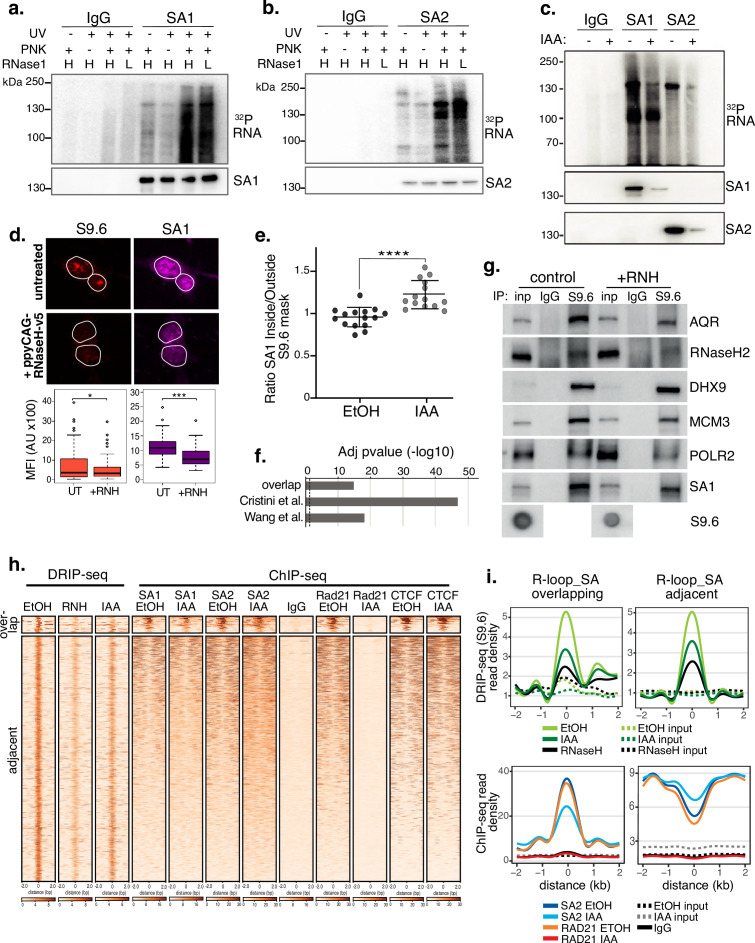
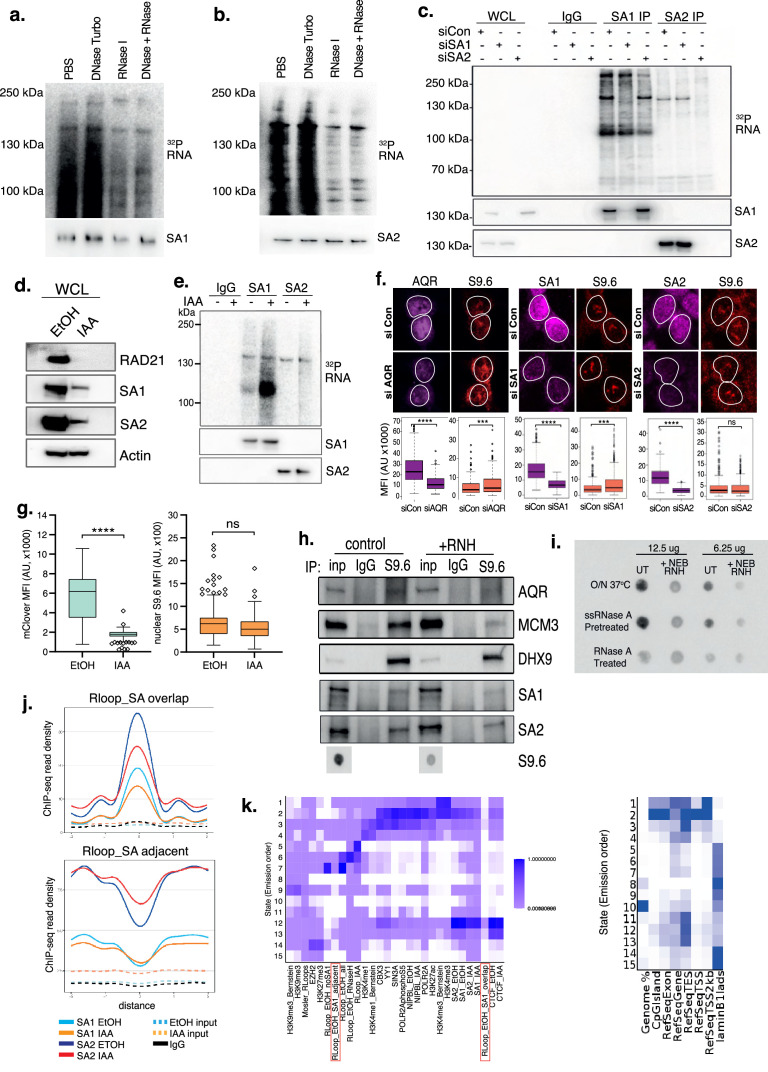
Figure 3. SA proteins bind to RNA and localize to R-loops.
CLIP for (a) SA1, (b) SA2 and IgG controls. Autoradiograms of crosslinked 32P-labeled RNA are shown at the top and the corresponding immunoblots, below. CLIP was performed with and without UV crosslinking and polynucleotide kinase (PNK) and with high (H; 1/50 dilution) or low (L; 1/500 dilution) concentrations of RNase I. (c) CLIP for (a) SA1, SA2 and IgG control in EtOH (-) or IAA-treated (+) Rad21mAC cells. 32P-labeled RNA and the corresponding immunoblots are shown as above. (d) Top, Representative confocal images of S9.6 and SA1 IF in RAD21mAC cells untreated or overexpressing ppyCAG-RNaseH-v5. Expressing cells were identified with v5 staining. Nuclear outlines (white) are derived from DAPI counterstain. Bottom, Imaris quantification of the relative mean fluorescence Intensity (MFI) of S9.6 and SA1. Data are from two biological replicates with >75 cells counted/condition. Quantifications and statistical analysis were done as above. (e) STORM analysis of localization density for SA1 in S9.6 masks in EtOH and IAA. Ratio of SA1 localizations inside and outside S9.6 masks is shown. Ratio of above 1 represents an enrichment within the S9.6 domain. Mean and SD are plotted, statistics based on One-Way Anova test. Data are from two biological replicates. (f) -log10 transformed adjusted p-value (FDR) for enrichment of S9.6 interactome data from Cristini et al. and Wang et al., with the SA1ΔCoh interactome. Overlap indicates the proteins identified in both of the S9.6 interactome datasets, representing a high confidence R-loop interactome list. (g) Chromatin coIP of S9.6 and IgG in RAD21mAC cells treated with RNase H and immunoblotted with antibodies representing known R-loop proteins, as well as SA1. Input represents 1.25% of the material used for immunoprecipitation. Bottom, S9.6 dot blot of lysates used in coIP. (h) deepTools heatmap of DRIP-seq and ChIP-seq from RAD21mAC cells. DRIP-seq was carried out in control (EtOH), RNase H (RNH), and IAA-treated cells. ChIP-seq was carried out for SA1, SA2, RAD21, CTCF, and IgG in EtOH and IAA-treated cells. Regions were selected based on DRIP-seq sensitivity to RNH and proximity with SA1 ChIP-seq. BEDTools identified regions of overlap or adjacent SA1 co-binding. (i) Summary plots showing mean DRIP-seq (top) or ChIP-seq (bottom) read density across the regions from (h), including sites of R-loop and SA ‘overlap’ (Left) or ‘adjacent’ (right) regions. Input samples are indicated with dotted lines.


