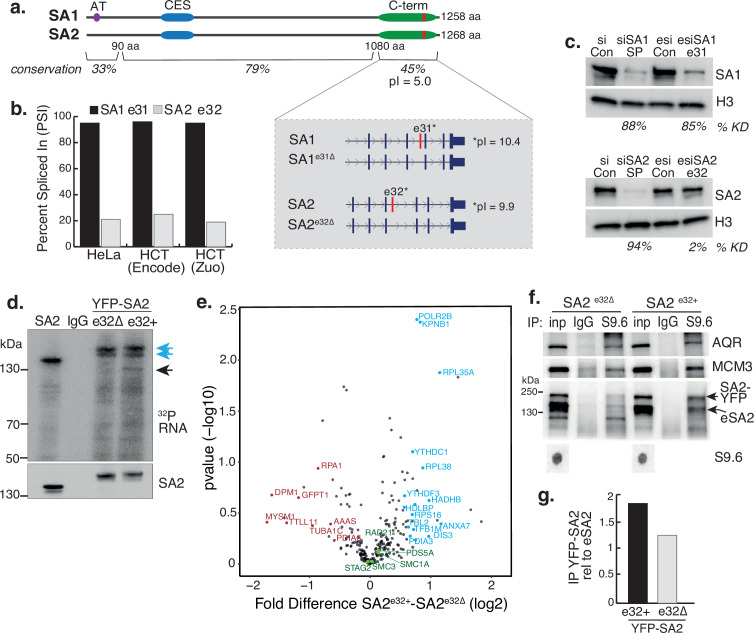
Figure 5. A basic exon in SA2 influences RBP stability.
(a) Schematic of the SA1 and SA2 proteins showing the SA1-specific AT-hook, the conserved CES domain (blue) and the acidic C-terminus (green) which contains the basic alternatively spliced exon (red). Right-hand zoom-in indicates the spliced exons for SA1 (top) and SA2 (bottom) and the pI for each. The conservation scores for the divergent N- and C-termini and the middle portion of the proteins which contains the CES domain are shown. (b) Percent Spliced In (PSI) calculations for SA1 exon 31 (black) and SA2 exon 32 (grey) based on VAST-Tools analysis of RNA-seq from multiple datasets (see Methods). (c) (top) Immunoblot analysis of SA1 levels in chromatin lysates after treatment with scrambled siRNAs (siCon), SmartPool SA1 siRNAs (siSA1 SP), control esiRNAs (esiCon) and esiRNA designed to target SA1 exon 31 for 48 hr in RAD21mAC cells. (bottom) Immunoblot analysis of SA2 levels in chromatin lysates after treatment with scrambled siRNAs (siCon), SmartPool SA2 siRNAs (siSA2 SP), control esiRNAs (esiCon) and siRNA designed to target SA2 exon 32 for 48 hr in RAD21mAC cells. H3 serves as a loading control. The percentage of knockdown (KD) after SA signal is normalized to H3 is shown. (d) CLIP for endogenous SA2 and IgG control in cells in which either YFP-tagged SA2 containing exon 32 (e32+) or YFP-tagged SA2 lacking exon 32 were expressed for 48 hrs. CLIP reveals RNA associated with SA2 (blue arrows) and RBPs which specifically associate with exon-32 containing SA2 (black arrow). (e) Volcano plot displaying the statistical significance (-log10 p-value) versus magnitude of change (log2 fold change) from IP-MS of HCT116 cells expressing either YFP-SA2e32+ or YFP-SA2e32∆ (n=3 biological replicate IP). Cohesin complex members are highlighted in green and the two most enriched functional categories of RNA-binding proteins in blue or Post-translational modification in red. (f) Chromatin coIP of S9.6 and IgG in RAD21mAC cells expressing the YFP-SA2 isoforms and immunoblotted with antibodies representing known R-loop proteins, as well as endogenous SA2 (eSA2). Input represents 1.25% of the material used for immunoprecipitation. Bottom, S9.6 dot blot of lysates used in coIP. NB the shift in SA2 signal representing overexpressed protein (SA2-YFP). (g) Quantification of the immunoblot signal from (f) of SA2 in the YFP-SA2 isoform band relative to input and to eSA2 signal. YFP-SA2e32+ is more enriched by S9.6 IP compared to YFP-SA2e32∆.


