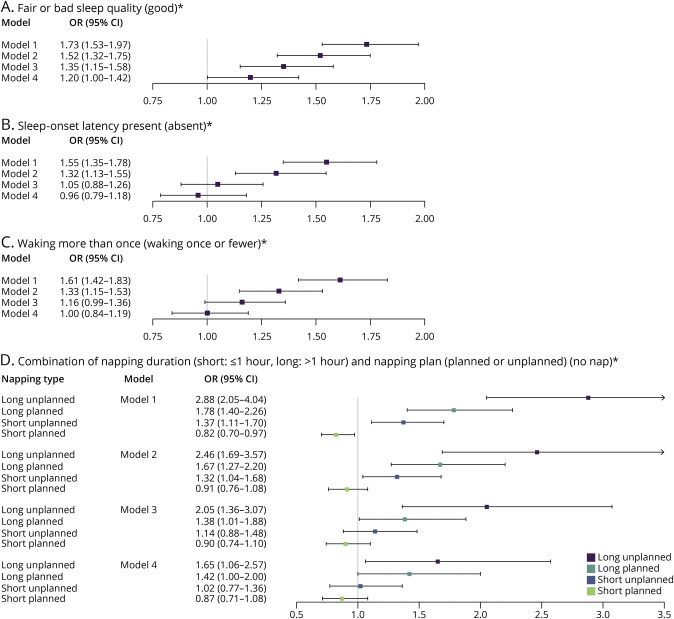
Figure 2. Odds of All Stroke for Poor or Fair Sleep Quality, Sleep-onset Latency, Waking More Than Once, and Napping Status.
Adjustment models are as follows: model 1: univariate (conditional); model 2: adjusted for occupation, age, marital status, and mRS at baseline (conditional); model 3: adjusted for occupation, age, marital status, mRS at baseline, alcohol consumption, smoking history, leisure physical activity, total AHEI score, waist-to-hip ratio, body mass index (kg/m2), depressive symptoms, and global stress (conditional); model 4: adjusted for occupation, age, marital status, mRS at baseline, alcohol consumption, smoking history, leisure physical activity, total AHEI score, waist-to-hip ratio, body mass index (kg/m2), depressive symptoms, global stress, a history of hypertension or adjusted BP >140/90 mm Hg at admission, a history of diabetes or hemoglobin A1c ≥6.5%, a history of atrial fibrillation/flutter, and a diagnosis of OSA (conditional). *For all panels (A–D), the reference level for each individual sleep parameter is displayed in brackets. AHEI = Alternative Healthy Eating Index; BP = blood pressure; mRS = modified Rankin scale; OR = odds ratio; OSA = obstructive sleep apnea.

