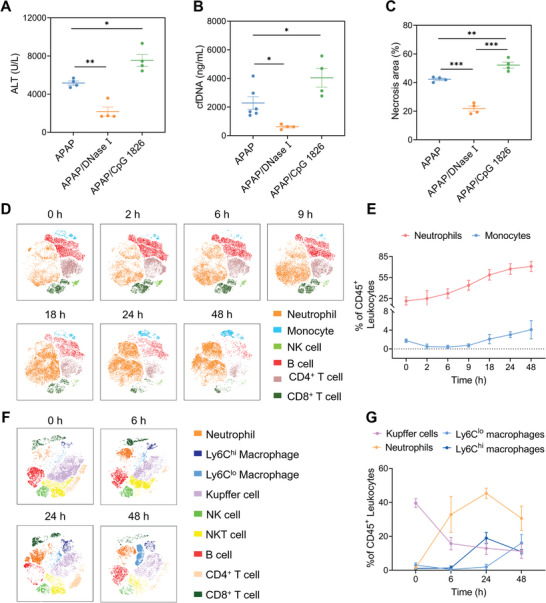
Figure 2.

The causative role of cfDNA and variation of leukocytes during AILI. Mice were treated with the DNase I at 3/10 h after APAP challenge (450 mg kg−1). CpG ODN 1826 was administrated at 3 h after APAP. A–C) Circulating ALT, cfDNA, and necrosis areas were determined at 24 h. D) t‐SNE analysis of leukocytes in peripheral blood at different time points after APAP. E) The dynamics of neutrophils and monocytes in peripheral blood. F) t‐SNE analysis of leukocytes in liver at different time points after APAP. G) The dynamics of Kupffer cells, neutrophils, Ly6Clo, and Ly6Chi macrophages. n = 3–6 for each group. Data are expressed as means ± SD, * p < 0.05, ** p < 0.01, *** p < 0.001.
