
Figure 1.
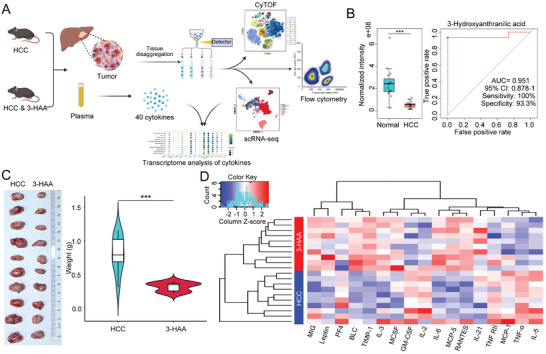
Overview of workflow and the anti‐tumor effects of 3‐HAA in HCC. A) The workflow of our study. B) LC‐MS examined the level of the metabolite 3‐HAA in tumor tissues compared with adjacent nontumor tissues in HCC patients (n = 15); Time‐dependent ROC curve for 3‐HAA in HCC. C) 3‐HAA treatment can significantly inhibit the growth of the tumor in the mice model of HCC. D) The different cytokines between the HCC and 3‐HAA groups. Red: high expression; Blue: low expression. ***P < 0.001. HCC, hepatocellular carcinoma; 3‐HAA, 3‐hydroxyanthranilic acid; LC‐MS, liquid chromatography–mass spectrometry; CyTOF, cytometry by time‐of‐flight; scRNA‐seq, single‐cell RNA sequencing.