
Figure 2.
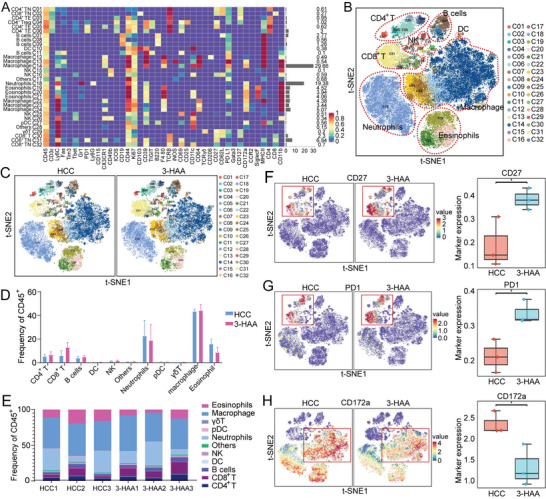
CyTOF analysis of intratumoral immune cells in HCC mice. A) The heatmap showing the expression of all selected panel markers for 32 cell clusters; Red: high expression; Purple: low expression. B) The t‐SNE plot presenting CyTOF data from all groups of immune cells in tumor tissue. C) The t‐SNE plot presenting CyTOF data from HCC group and 3‐HAA group of immune cells in tumor tissue. D) The proportions of distinct cell subsets (n = 3 per group). E) The proportional distribution of the distinct immune cell subtypes. F‐H) t‐SNE diagram and statistical analysis of the difference between two groups of cell functional markers CD27, PD‐1, and CD172. *P < 0.05. HCC, hepatocellular carcinoma; 3‐HAA, 3‐hydroxyanthranilic acid; t‐SNE, t‐distributed stochastic neighbor embedding.