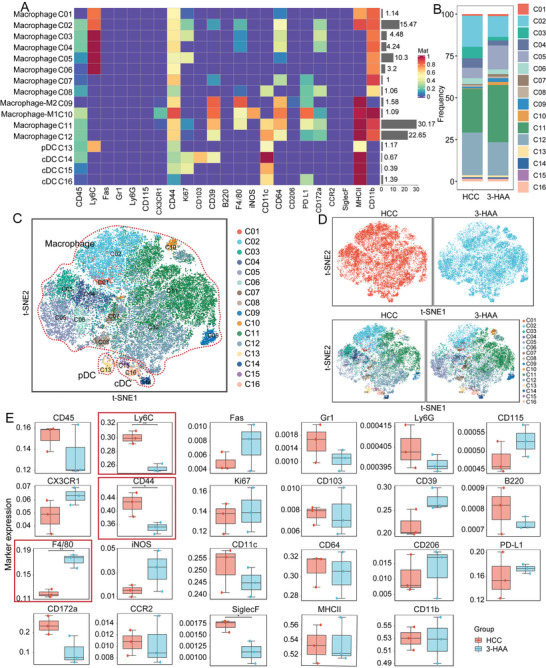
Figure 3.

CyTOF analysis of TAMCs in HCC mice. A) Heatmaps of the expression levels of myeloid cell‐surface markers among myeloid cell subpopulations. Red: high expression; Purple: low expression. B) The proportional distribution of the myeloid cell subpopulations. C and D) t‐SNE plot of all groups and each indicated group of TAMCs populations. E) Bar plots of frequency and distribution for selected expression markers. *P < 0.05; **P < 0.01. HCC, hepatocellular carcinoma; 3‐HAA, 3‐hydroxyanthranilic acid; t‐SNE, t‐distributed stochastic neighbor embedding.
