
Figure 4.
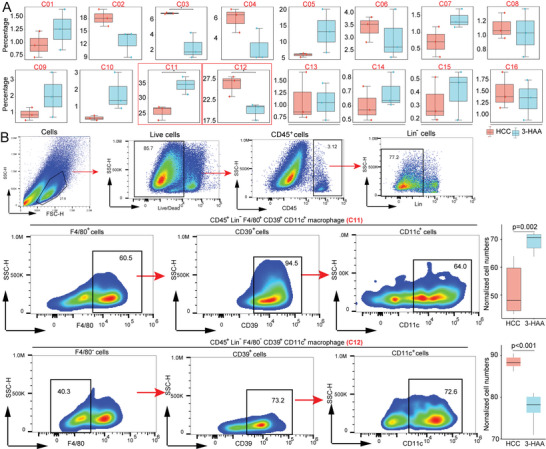
3‐HAA remodels macrophage phenotypes in the mice model of HCC. A) Bar plots of the percentage of macrophage subsets in the two groups. B) Representative flow cytometric dot plots and percentages of CD45+F4/80+CD64+CD39+CD44+CD11b+CD11c+PD−L1+ macrophage and CD45+CD64+CD39+CD44+CD11b+CD11c+ macrophage. *P < 0.05; **P < 0.01; ***P < 0.001. HCC, hepatocellular carcinoma; 3‐HAA, 3‐hydroxyanthranilic acid.