
Figure 5.
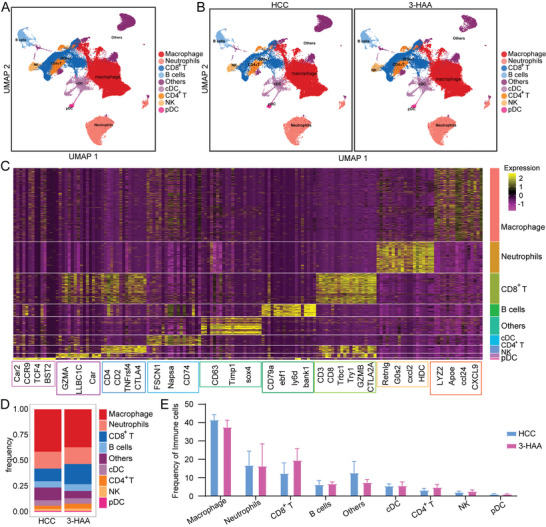
scRNA‐seq showing the nine major clusters on the immune cell island. A and B) UMAP plot of all groups and each indicated group of the nine major clusters. C) Heatmap showing the expression level of canonical genes among nine major clusters. D) The proportional distribution of the nine immune cells clusters. E) Bar plots of frequency for all types of immune cells. HCC, hepatocellular carcinoma; 3‐HAA, 3‐hydroxyanthranilic acid; UMAP, uniform manifold approximation and projection.