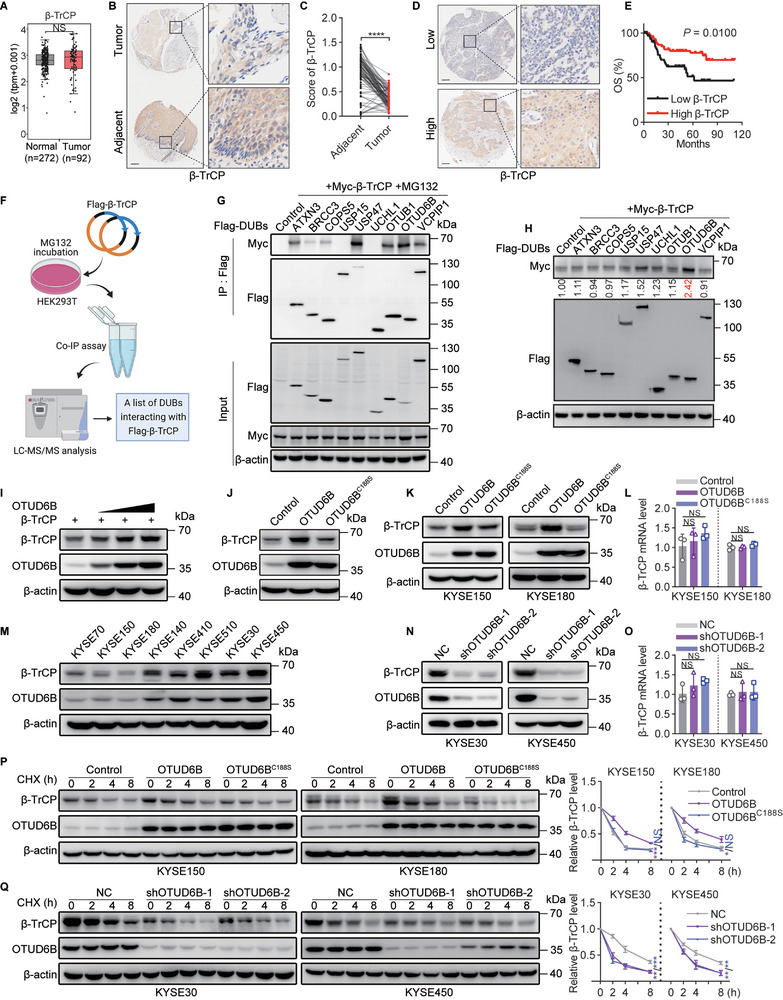
Figure 1.

OTUD6B enhances β‐TrCP protein stability. A) The relative transcript levels of β‐TrCP in ESCC and normal tissues were analyzed using the transcriptome profiles in TCGA and GTEx data. Wilcoxon test, NS, not significant (p > 0.05). B) The expression of β‐TrCP in 85 paired ESCC and adjacent normal tissues was detected by immunohistochemistry, and C) the relative expression of β‐TrCP was analyzed. Paired t‐test, **** p < 0.0001. D) The expression of β‐TrCP in 128 ESCC tissues was detected by immunohistochemistry, and E) the overall survival of 128 ESCC patients stratified by OTUD6B expression. Two‐sided log‐rank test. F) A schematic diagram shows the immunoprecipitated screening for potential DUBs interacting with β‐TrCP. G) The indicated DUBs and β‐TrCP were co‐transfected into HEK293T cells. The interaction of potential DUBs and β‐TrCP was detected by immunoprecipitation. H) The indicated DUBs and β‐TrCP were co‐transfected into HEK293T cells. The expression of β‐TrCP was detected by immunoblotting and qualified. I) Increasing quantities of OTUD6B plasmid were transfected into HEK293T cells and β‐TrCP expression was detected. J) OTUD6B or OTUD6BC188S was transfected into HEK293T cells, and β‐TrCP expression was detected. K) The protein and L) mRNA levels of β‐TrCP were detected in KYSE150 and KYSE180 cells overexpressing OTUD6B or OTUD6BC188S. n = 3, mean ± SEM, unpaired t‐test, NS, not significant (p > 0.05). M) The protein levels of OTUD6B and β‐TrCP in ESCC cell lines were detected. N) The protein and O) mRNA levels of β‐TrCP were detected in OTUD6B‐knockdown KYSE30 and KYSE450 cells. n = 3, mean ± SEM, unpaired t‐test, NS, not significant (p > 0.05). P) The degradation of β‐TrCP in OTUD6B or OTUD6BC188S ‐overexpressing KYSE150 and KYSE180 cells treated with CHX (50 µg mL−1) for 2, 4, 8 h. n = 3, mean ± SD, unpaired t‐test, * p < 0.05, *** p < 0.001, NS, not significant (p > 0.05). Q) The degradation of β‐TrCP in OTUD6B‐knockdown KYSE30 and KYSE450 cells treated with CHX (50 µg mL−1) for 2, 4, 8 h. n = 3, mean ± SD, unpaired t‐test, ** p < 0.01, *** p < 0.001. The data shown in G‐K, M, N, P, and Q are from a representative experiment in at least two replicates.
