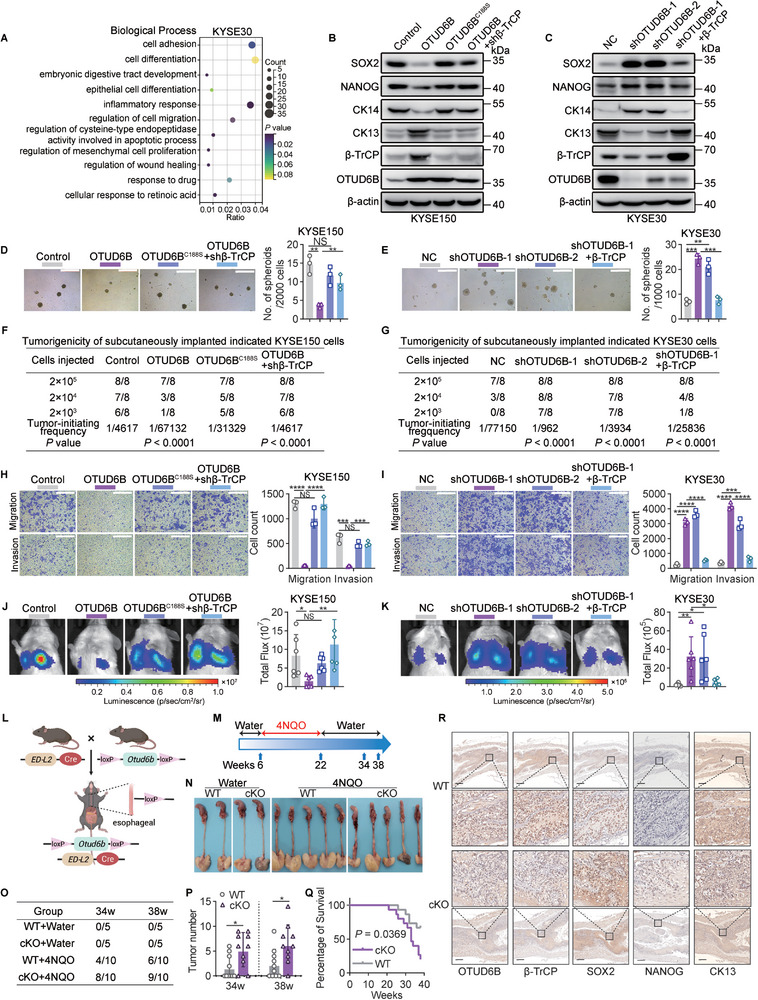
Figure 3.

OTUD6B reduces TIC properties of ESCC cells via β‐TrCP. A) KYSE30 cells with or without OTUD6B‐knockdown were subjected to RNA‐seq and gene ontology (GO) analysis. A bubble chart shows the partial enriched terms of biological processes. The RNA‐sequencing data are available at the Gene Expression Omnibus (GEO) database (accession GSE209521). B) The levels of SOX2, NANOG, CK14, and CK13 in the indicated KYSE150 cells and C) KYSE30 cells. Data from a representative experiment in at least two replicates. D) The spheroid formation capacity of the indicated KYSE150 cells and E) KYSE30 cells. Scale bars, 500 µm. n = 3, mean ± SEM, unpaired t‐test, ** p < 0.01, *** p < 0.001, NS, not significant (p > 0.05). F) The indicated KYSE150 cells and G) KYSE30 cells were subcutaneously injected into BALB/c nude mice to detect the tumor formation rates. H) The migration and invasion capabilities of the indicated KYSE150 cells and I) KYSE30 cells. Scale bars, 500 µm. n = 3, mean ± SEM, unpaired t‐test, *** p < 0.001, **** p < 0.0001, NS, not significant (p > 0.05). J) The indicated KYSE150 cells and K) KYSE30 cells were injected into the tail vein of NOD/SCID mice. Lung metastasis was detected by bioluminescence imaging. n = 6, mean ± SD, unpaired t‐test, * p < 0.05, ** p < 0.01, NS, not significant (p > 0.05). L) A model of Otud6b esophageal epithelium‐specific conditional knockout (cKO) mice. M) A schematic diagram shows the 4NQO‐induced carcinogenesis model. N) Representative images of the esophagus in 4NQO‐induced Otud6b WT and cKO mice. O) The tumor formation rates and P) tumor number of the esophagus in 4NQO‐induced Otud6b WT and cKO mice. n = 10, mean ± SD, unpaired t‐test, * p < 0.05. Q) The overall survival of Otud6b WT and cKO mice treated with 4NQO. n = 15, Pearson's test. R) IHC staining of the indicated proteins in the esophagus of 4NQO‐induced Otud6b WT and cKO mice.
