
Figure 4.
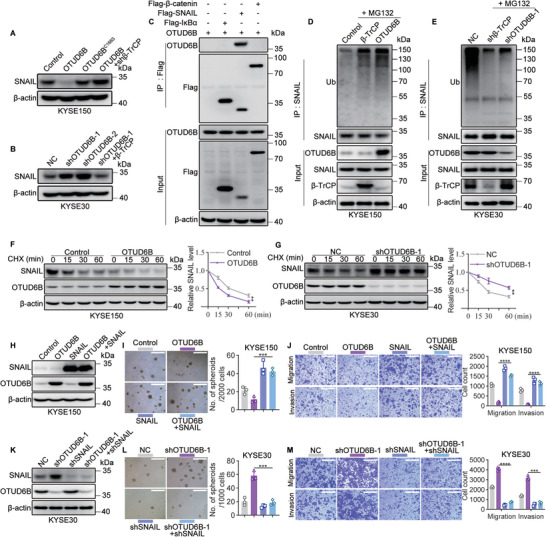
OTUD6B promotes the degradation of SNAIL. A) The levels of SNAIL in the indicated KYSE150 cells and B) KYSE30 cells were detected by immunoblotting. C) Flag‐β‐catenin, flag‐SNAIL, or flag‐IκBα was co‐transfected with OTUD6B into HEK293T cells. Their interactions were detected by immunoprecipitation assay. D) The ubiquitination level of SNAIL in OTUD6B‐ or β‐TrCP‐ overexpressing KYSE150 cells. E) The ubiquitination level of SNAIL in β‐TrCP‐knockdown or OTUD6B‐knockdown KYSE30 cells. F) The degradation of SNAIL in OTUD6B‐overexpressing KYSE150 cells treated with CHX (50 µg mL−1) for 15, 30, 60 min. n = 3, mean ± SD, unpaired t‐test, ** p < 0.01. G) The degradation of SNAIL in OTUD6B‐knockdown KYSE30 cells treated with CHX (50 µg mL−1) for 15, 30, 60 min. n = 3, mean ± SD, unpaired t‐test, ** p < 0.01. H) SNAIL was overexpressed in OTUD6B‐overexpressing or control KYSE150 cells. The levels of SNAIL and OTUD6B were detected by immunoblotting. I) The spheroid formation capacity and J) migration and invasion capabilities of the indicated KYSE150 cells. Scale bars, 500 µm. n = 3, mean ± SEM, unpaired t‐test, *** p < 0.001, **** p < 0.0001. K) SNAIL was knocked down in OTUD6B‐knockdown KYSE30 cells. The levels of SNAIL and OTUD6B were detected by immunoblotting. L) The spheroid formation capacity and M) migration and invasion capabilities of the indicated KYSE30 cells were detected. Scale bars, 500 µm. n = 3, mean ± SEM, unpaired t‐test, *** p < 0.001, **** p < 0.0001. The data shown in (A)–(G) are from a representative experiment in at least two replicates.