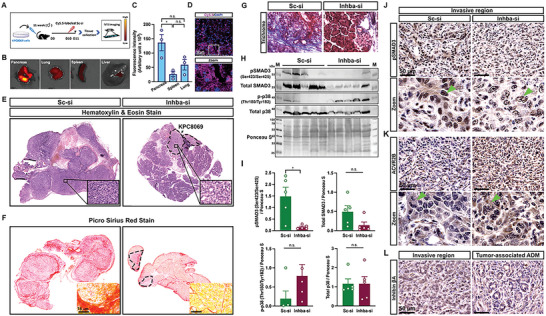
Figure 4.

Tumor activin A suppression prevents cancer invasion and fibrosis accumulation through SMAD3 inactivation. A) Experimental design for PCX biodistribution (n = 3); 12‐week‐old orthotopic mice were intraperitoneally injected with Cy5.5‐labeled scramble siRNA at D10. After 24 h, tumors and tissues were harvested, and Cy5.5 tissue accumulation was evaluated under IVIS. B) Representative image of Cy5.5 fluorescence. C) Fluorescence intensities were measured by ImageJ and compared. D) Representative Cy5.5 and DAPI fluorescence images of frozen‐sectioned tumor tissue. Scale bar = 50 µm. E,F) Representative H&E and PSR staining of tumor sections from Sc‐si and Inhba‐si groups. Black‐dotted circles for KPC8069 tumor cells in Inhba‐si groups. G) Representative Trichrome staining of tumor sections (n = 5/group). H) Western blot bands. M, marker. I) Relative protein expression that is normalized by ponceau S staining. J–L) Representative DAB staining for pSMAD3, ACVR2B, and inhibin βA of tumor sections (n = 5/group). Green arrows indicate the signals of each protein. Scale bar = 50 µm. *P<0.05; n.s., not significant.
